Review
. 2009 Aug;21(8):2194-202.
doi: 10.1105/tpc.109.068437. Epub 2009 Aug 4.

Association mapping: critical considerations shift from genotyping to experimental design

Affiliations
Review

Association mapping: critical considerations shift from genotyping to experimental design

Sean Myles et al. Plant Cell. 2009 Aug.

Abstract

The goal of many plant scientists' research is to explain natural phenotypic variation in terms of simple changes in DNA sequence. Traditionally, linkage mapping has been the most commonly employed method to reach this goal: experimental crosses are made to generate a family with known relatedness, and attempts are made to identify cosegregation of genetic markers and phenotypes within this family. In vertebrate systems, association mapping (also known as linkage disequilibrium mapping) is increasingly being adopted as the mapping method of choice. Association mapping involves searching for genotype-phenotype correlations in unrelated individuals and often is more rapid and cost-effective than traditional linkage mapping. We emphasize here that linkage and association mapping are complementary approaches and are more similar than is often assumed. Unlike in vertebrates, where controlled crosses can be expensive or impossible (e.g., in humans), the plant scientific community can exploit the advantages of both controlled crosses and association mapping to increase statistical power and mapping resolution. While the time and money required for the collection of genotype data were critical considerations in the past, the increasing availability of inexpensive DNA sequencing and genotyping methods should prompt researchers to shift their attention to experimental design. This review provides thoughts on finding the optimal experimental mix of association mapping using unrelated individuals and controlled crosses to identify the genes underlying phenotypic variation.


Figures
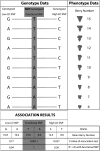
Figure 1.
Figure 1.
A Fictional Depiction of a Simple Genotype-Phenotype Association Test. The functional SNP responsible for variation in berry number in grapevine is in gray and is not genotyped. The genotyped SNPs lie on either side of the functional SNP. The genotyped SNP to the right is in high LD with the functional SNP, while the genotyped SNP to the left is not in LD with the functional SNP. The results of a simple association test (Pearson correlation) are shown in the bottom box. The C allele of the high LD SNP is significantly associated with berry number (P = 0.037), while there is no significant association for the low LD SNP (P = 0.77).
Figure 2.
Figure 2.
Important factors affecting the power of population mapping studies. (A) The power of an association test is a function of the allele frequency and the effect size. (B) The allele frequency spectrum from 3641 SNPs genotyped in 25 diverse maize inbred lines (www.panzea.org) demonstrates that most alleles in a population are rare. Therefore, if the frequency spectrum of functional alleles is similar to the frequency spectrum of random SNPs, most functional alleles will remain undetected through population mapping because of low power. For (A), phenotype data were simulated for 1000 haploid samples as a normal distribution with mean = 0 and sd = 1 for one allele and mean 0 + effect size and sd = 1 for the other allele. Effect size is therefore defined as the difference between the mean phenotypic values of the two alleles. Power is defined as the proportion of association tests (Pearson correlation) significant at P < 0.05 out of 5000 simulated data sets.
Figure 3.
Figure 3.
The Expected Genetic Contribution from Each Parent to the Progeny of a Biparental RIL Family with a Genetic Map Size of Maize. Progeny can be much more closely related to one parent than another. In fact, ∼9% of progeny are ≥2 times more closely related to one parent than the other.
Figure 4.
Figure 4.
Genotype-Phenotype Covariance Can Be Broken up by Generating Controlled Crosses. The left panel is a scenario of an extreme correlation between relatedness and phenotypic similarity. Individuals, represented by dots, who are closely related have similar phenotypes, and distantly related individuals are more phenotypically dissimilar. In these cases, random genetic markers throughout the genome will be strongly associated with the phenotype, and population mapping will therefore lack power to detect real QTL. By generating controlled crosses, this genotype-phenotype covariance can be broken, and a population of individuals can be generated in which this correlation is weakened. In the right panel, phenotypic differences between individuals are no longer strongly associated with relatedness, and the power to detect QTL is significantly enhanced.

References

    1. Altshuler, D., Daly, M.J., and Lander, E.S. (2008). Genetic mapping in human disease. Science 322: 881–888. - PMC - PubMed
    1. Andersen, J.R., Schrag, T., Melchinger, A.E., Zein, I., and Lübberstedt, T. (2005). Validation of Dwarf8 polymorphisms associated with flowering time in elite European inbred lines of maize (Zea mays L.). Theor. Appl. Genet. 111: 206–217. - PubMed
    1. Aranzana, M.J., et al. (2005). Genome-wide association mapping in Arabidopsis identifies previously known flowering time and pathogen resistance genes. PLoS Genet. 1: e60. - PMC - PubMed
    1. Balasubramanian, S., Sureshkumar, S., Agrawal, M., Michael, T.P., Wessinger, C., Maloof, J.N., Clark, R., Warthmann, N., Chory, J., and Weigel, D. (2006). The PHYTOCHROME C photoreceptor gene mediates natural variation in flowering and growth responses of Arabidopsis thaliana. Nat. Genet. 38: 711–715. - PMC - PubMed
    1. Bernardo, R. (1993). Estimation of coefficient of coancestry using molecular markers in maize. Theor. Appl. Genet. 85: 1055–1062. - PubMed

LinkOut - more resources