

Mechanisms to conserve glucose in lactating women during a 42-h fast
- PMID: 19654284
- PMCID: PMC2763788
- DOI: 10.1152/ajpendo.00364.2009
Mechanisms to conserve glucose in lactating women during a 42-h fast
Abstract
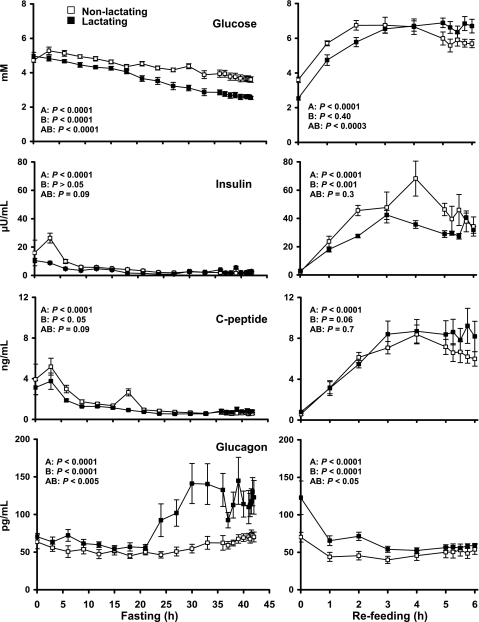
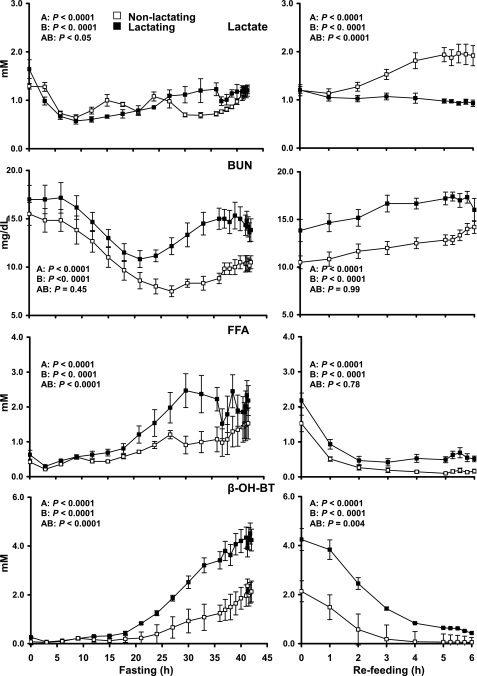
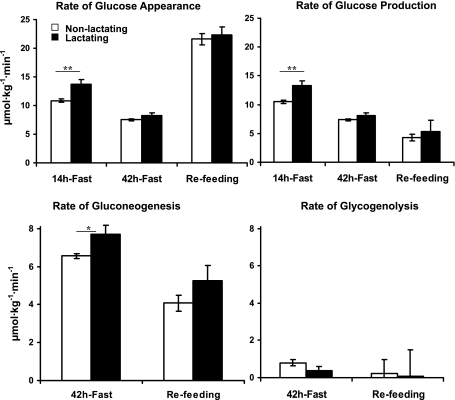
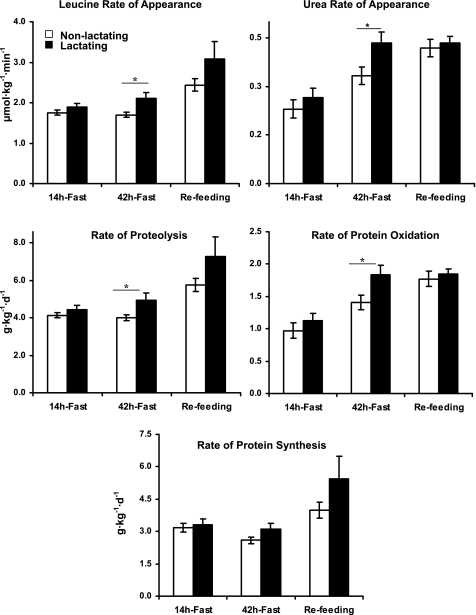
Little is known about how lactating women accommodate for their increased glucose demands during fasting to avoid maternal hypoglycemia. The objective of this study was to determine whether lactating women conserve plasma glucose by reducing maternal glucose utilization by increasing utilization of FFA and ketone bodies and/or increasing gluconeogenesis and mammary gland hexoneogenesis. Six healthy exclusively breastfeeding women and six nonlactating controls were studied during 42 h of fasting and 6 h of refeeding. Glucose and protein kinetic parameters were measured using stable isotopes and GCMS and energy expenditure and substrate oxidation using indirect calorimetry. After 42 h of fasting, milk production decreased by 16% but remained within normal range. Glucose, insulin, and C-peptide concentrations decreased with the duration of fasting in both groups but were lower (P < 0.05) in lactating women. Glucagon, FFA, and beta-hydroxybutyrate concentrations increased with fasting time (P < 0.001) and were higher (P < 0.0001) in lactating women during both fasting and refeeding. During 42 h of fasting, gluconeogenesis was higher in lactating women compared with nonlactating controls (7.7 +/- 0.4 vs. 6.5 +/- 0.2 micromol kg(-1) min(-1), P < 0.05), whereas glycogenolysis was suppressed to similar values (0.4 +/- 0.1 vs. 0.9 +/- 0.2 micromol kg(-1) min(-1), respectively). Mammary hexoneogenesis did not increase with the duration of fasting. Carbohydrate oxidation was lower and fat and protein oxidations higher (P < 0.05) in lactating women. In summary, lactating women are at risk for hypoglycemia if fasting is extended beyond 30 h. The extra glucose demands of extended fasting during lactation appear to be compensated by increasing gluconeogenesis associated with ketosis, decreasing carbohydrate oxidation, and increasing protein and FFA oxidations.
Figures
References
-
- Beaufrere B, Horber FF, Schwenk WF, Marsh HM, Matthews D, Gerich JE, Haymond MW. Glucocorticosteroids increase leucine oxidation and impair leucine balance in humans. Am J Physiol Endocrinol Metab 257: E712–E721, 1989 - PubMed
-
- Borschel MW, Kirksey A, Hannemann RE. Evaluation of test-weighing for the assessment of milk volume intake of formula-fed infants and its application to breast-fed infants. Am J Clin Nutr 43: 367–373, 1986 - PubMed
-
- Brosnan JT, McPhee P, Hall B, Parry DM. Renal glutamine metabolism in rats fed high-protein diets. 235: Am J Physiol E261–E265, 1978 - PubMed
-
- Chacko SK, Sunehag AL, Sharma S, Sauer PJ, Haymond MW. Measurement of gluconeogenesis using glucose fragments and mass spectrometry after ingestion of deuterium oxide. J Appl Physiol 104: 944–951, 2008 - PubMed
-
- Conwell LS, Trost SG, Brown WJ, Batch JA. Indexes of insulin resistance and secretion in obese children and adolescents: a validation study. Diabetes Care 27: 314–319, 2004 - PubMed
Publication types
MeSH terms
Substances
Grants and funding
LinkOut - more resources
Full Text Sources
Miscellaneous