

Antigen presented by tumors in vivo determines the nature of CD8+ T-cell cytotoxicity
- PMID: 19654302
- PMCID: PMC2727577
- DOI: 10.1158/0008-5472.CAN-09-0685
Antigen presented by tumors in vivo determines the nature of CD8+ T-cell cytotoxicity
Abstract
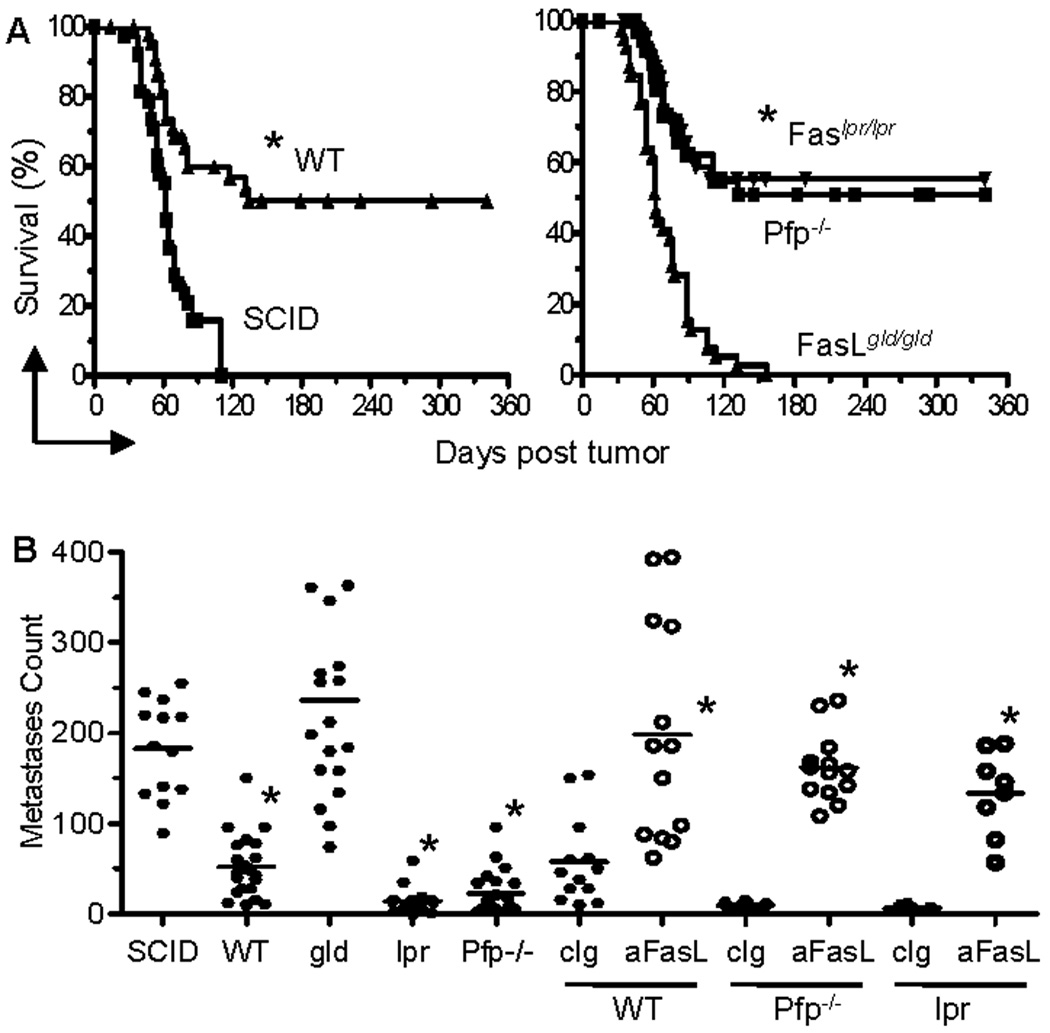
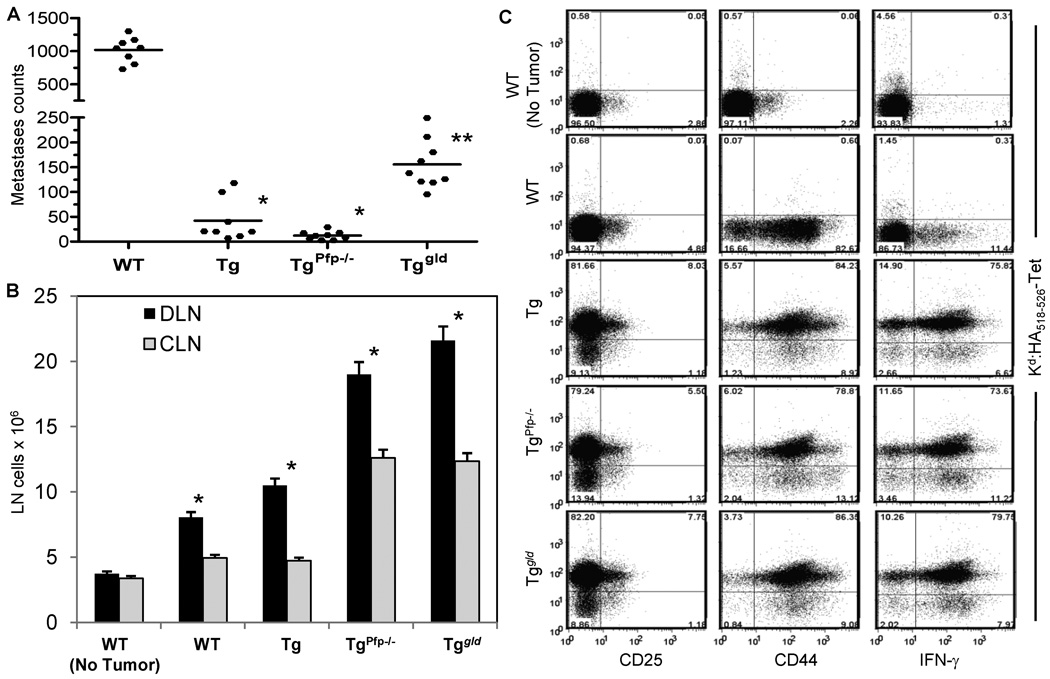
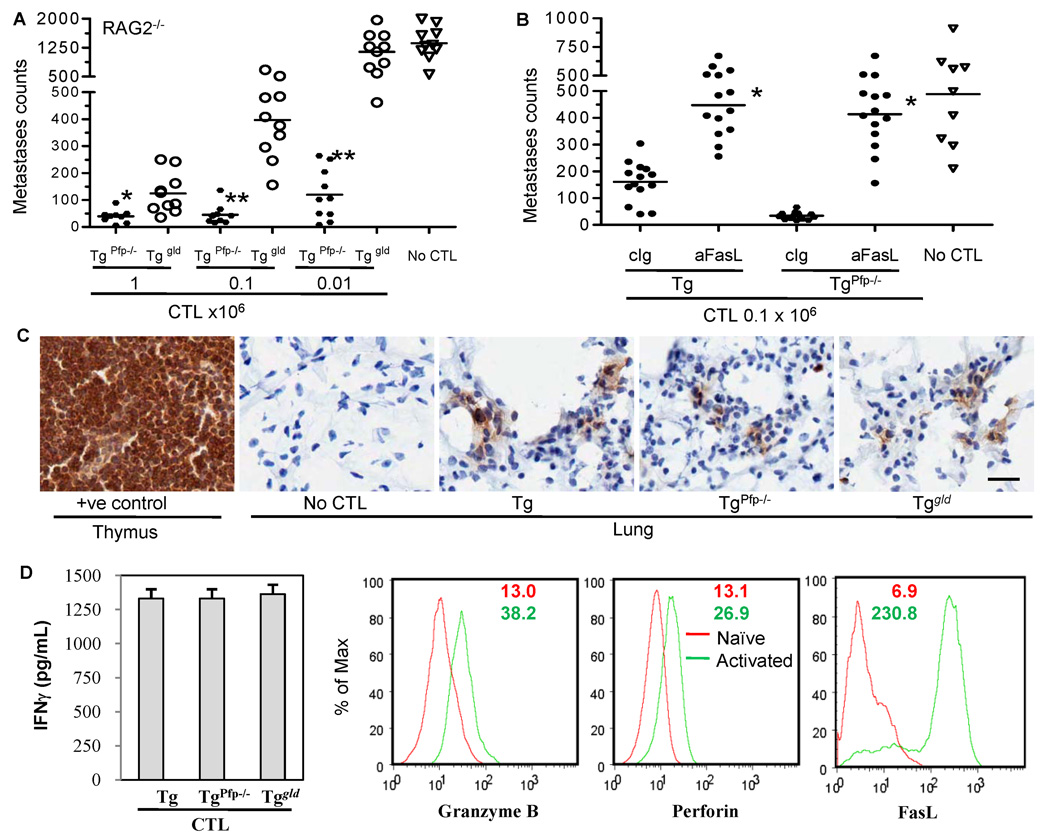
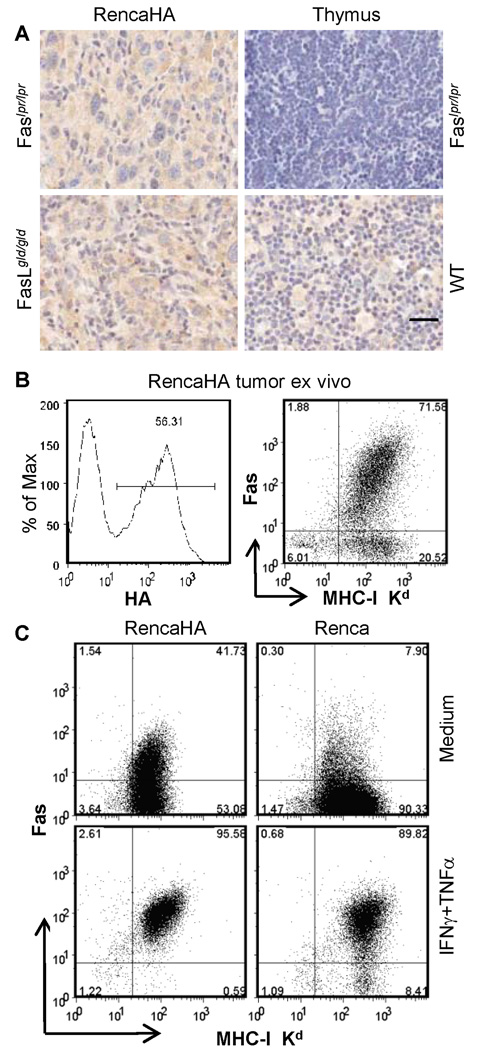
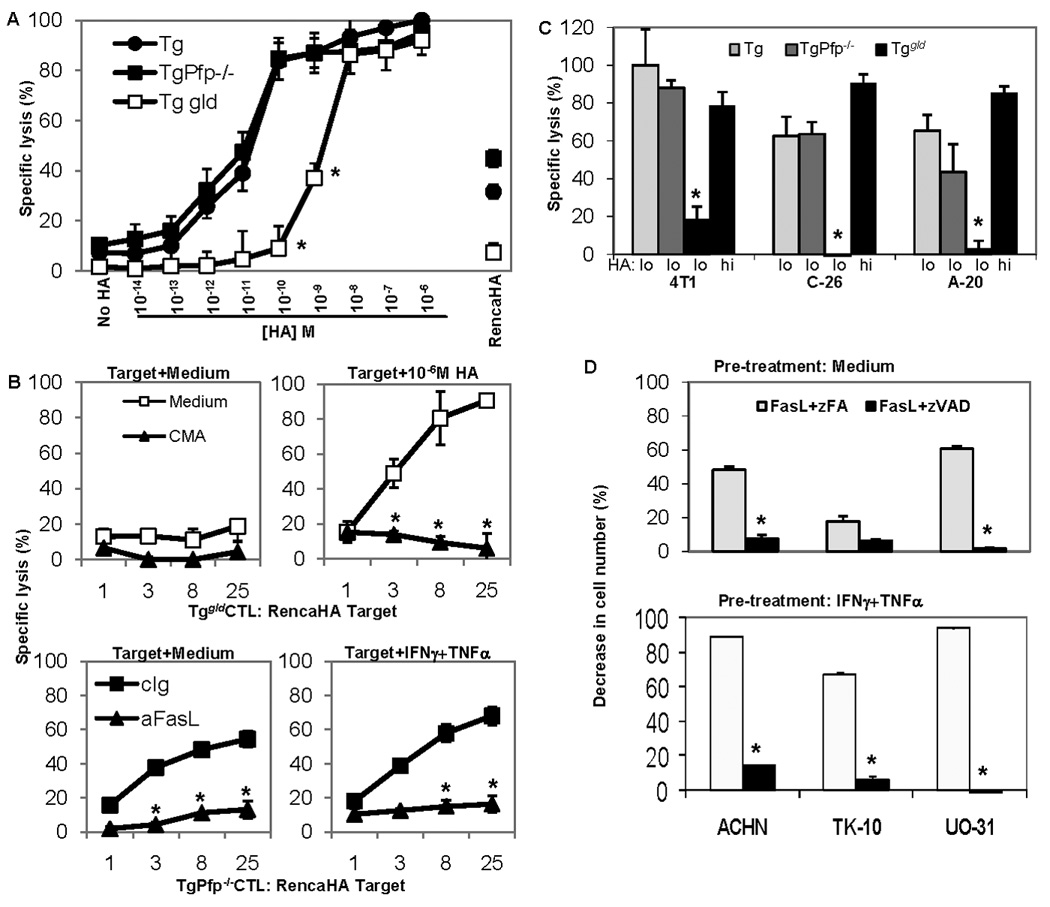
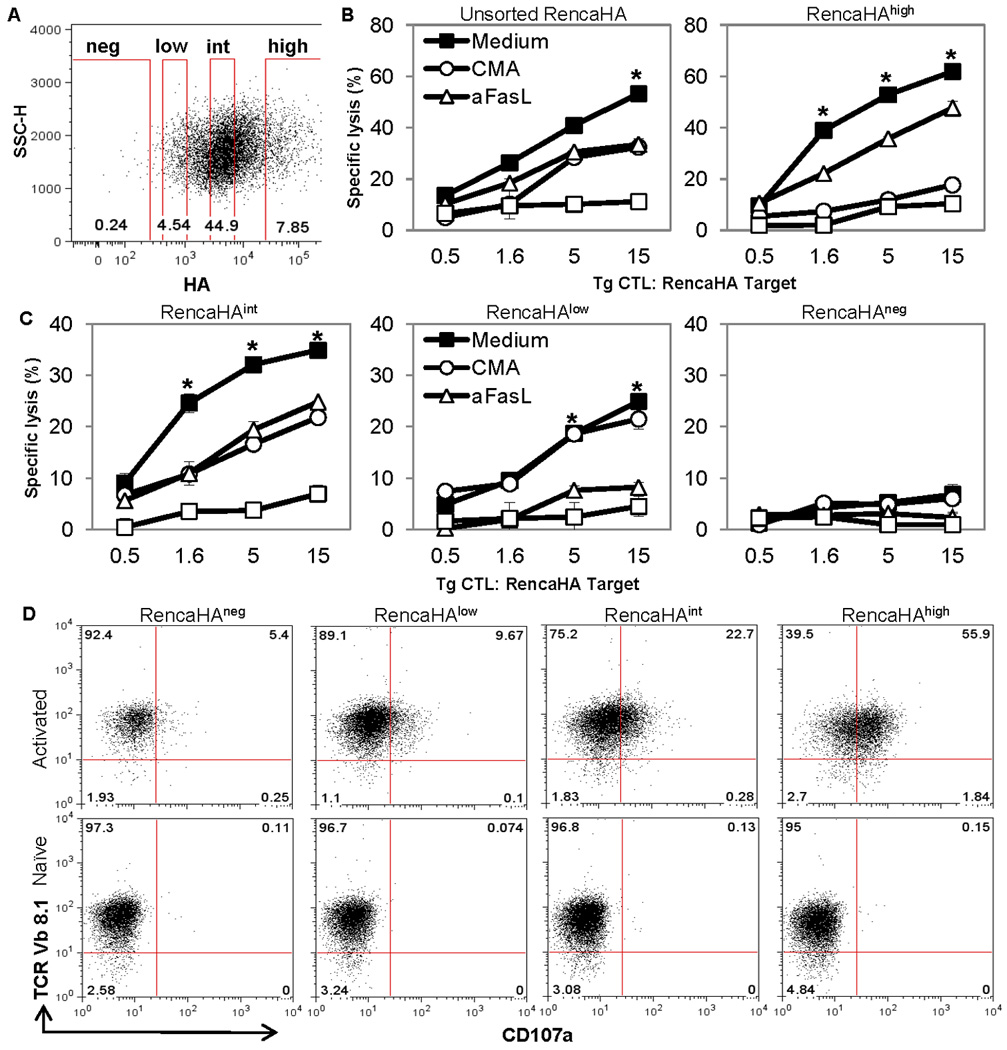
The biological relevance of the perforin and Fas ligand (FasL) cytolytic pathways of CD8(+) T lymphocytes (CTL) for cancer immunotherapy is controversial. We investigated the importance of these pathways in a murine renal cell carcinoma expressing influenza viral hemagglutinin as a defined surrogate antigen (Renca-HA). Following Renca-HA injection, all FasL-dysfunctional FasL(gld/gld) mice (n = 54) died from Renca-HA tumors by day 62. By contrast, perforin(-/-) (51%; n = 45) and Fas(lpr/lpr) (55%; n = 51) mice remained tumor-free at day 360. Blocking FasL in vivo inhibited tumor rejection in these mice. Moreover, established Renca-HA tumors were cleared more efficiently by adoptively transferred HA(518-526)-specific T-cell receptor-transgenic CTL using FasL rather than perforin. Strikingly, a range of mouse tumor cells presenting low concentrations of immunogenic peptide were all preferentially lysed by the FasL but not the Pfp-mediated effector pathway of CTL, whereas at higher peptide concentrations, the preference in effector pathway usage by CTL was lost. Interestingly, a number of human renal cancer lines were also susceptible to FasL-mediated cytotoxicity. Therefore, the FasL cytolytic pathway may be particularly important for eradicating Fas-sensitive tumors presenting low levels of MHC class I-associated antigens following adoptive T-cell therapy.
Figures
Similar articles
-
Tumor-specific CTL kill murine renal cancer cells using both perforin and Fas ligand-mediated lysis in vitro, but cause tumor regression in vivo in the absence of perforin.J Immunol. 2002 Apr 1;168(7):3484-92. doi: 10.4049/jimmunol.168.7.3484. J Immunol. 2002. PMID: 11907109
-
The Fas/Fas ligand pathway is important for optimal tumor regression in a mouse model of CTL adoptive immunotherapy of experimental CMS4 lung metastases.J Immunol. 2003 Sep 1;171(5):2402-12. doi: 10.4049/jimmunol.171.5.2402. J Immunol. 2003. PMID: 12928387
-
Molecular mechanisms of immune-mediated lysis of murine renal cancer: differential contributions of perforin-dependent versus Fas-mediated pathways in lysis by NK and T cells.J Immunol. 1998 Oct 15;161(8):3957-65. J Immunol. 1998. PMID: 9780164
-
Mechanism and biological significance of CD4-mediated cytotoxicity.Immunol Rev. 1995 Aug;146:57-79. doi: 10.1111/j.1600-065x.1995.tb00684.x. Immunol Rev. 1995. PMID: 7493761 Review.
-
Hyper-interleukin-11 novel designer molecular adjuvant targeting gp130 for whole cell cancer vaccines.Expert Opin Biol Ther. 2011 Dec;11(12):1555-67. doi: 10.1517/14712598.2011.627852. Epub 2011 Oct 14. Expert Opin Biol Ther. 2011. PMID: 21995459 Review.
Cited by
-
Fas ligand-mediated immune surveillance by T cells is essential for the control of spontaneous B cell lymphomas.Nat Med. 2014 Mar;20(3):283-90. doi: 10.1038/nm.3442. Epub 2014 Feb 2. Nat Med. 2014. PMID: 24487434
-
Eradication of metastatic renal cell carcinoma after adenovirus-encoded TNF-related apoptosis-inducing ligand (TRAIL)/CpG immunotherapy.PLoS One. 2012;7(2):e31085. doi: 10.1371/journal.pone.0031085. Epub 2012 Feb 1. PLoS One. 2012. PMID: 22312440 Free PMC article.
-
Challenges and future perspectives of T cell immunotherapy in cancer.Immunol Lett. 2015 Aug;166(2):117-33. doi: 10.1016/j.imlet.2015.05.018. Epub 2015 Jun 19. Immunol Lett. 2015. PMID: 26096822 Free PMC article. Review.
-
NF-κB directly regulates Fas transcription to modulate Fas-mediated apoptosis and tumor suppression.J Biol Chem. 2012 Jul 20;287(30):25530-40. doi: 10.1074/jbc.M112.356279. Epub 2012 Jun 5. J Biol Chem. 2012. PMID: 22669972 Free PMC article.
-
Associação Brasileira de Hematologia, Hemoterapia e Terapia Celular Consensus on genetically modified cells. VIII: CAR-T cells: preclinical development - Safety and efficacy evaluation.Hematol Transfus Cell Ther. 2021 Nov;43 Suppl 2(Suppl 2):S54-S63. doi: 10.1016/j.htct.2021.09.008. Hematol Transfus Cell Ther. 2021. PMID: 34794798 Free PMC article.
References
-
- Yang JC, Childs R. Immunotherapy for renal cell cancer. J Clin Oncol. 2006;24:5576–5583. - PubMed
-
- Sayers TJ, Brooks AD, Lee JK, et al. Molecular mechanisms of immune-mediated lysis of murine renal cancer: differential contributions of perforin-dependent versus Fas-mediated pathways in lysis by NK and T cells. J Immunol. 1998;161:3957–3965. - PubMed
-
- Smyth MJ, Kelly JM, Sutton VR, et al. Unlocking the secrets of cytotoxic granule proteins. J Leukoc Biol. 2001;70:18–29. - PubMed
-
- Henkart PA, Catalfamo M. CD8+ effector cells. Adv Immunol. 2004;83:233–252. - PubMed
Publication types
MeSH terms
Substances
Grants and funding
LinkOut - more resources
Full Text Sources
Molecular Biology Databases
Research Materials
Miscellaneous
