

hCLCA2 Is a p53-Inducible Inhibitor of Breast Cancer Cell Proliferation
- PMID: 19654313
- PMCID: PMC2745301
- DOI: 10.1158/0008-5472.CAN-08-4101
hCLCA2 Is a p53-Inducible Inhibitor of Breast Cancer Cell Proliferation
Abstract
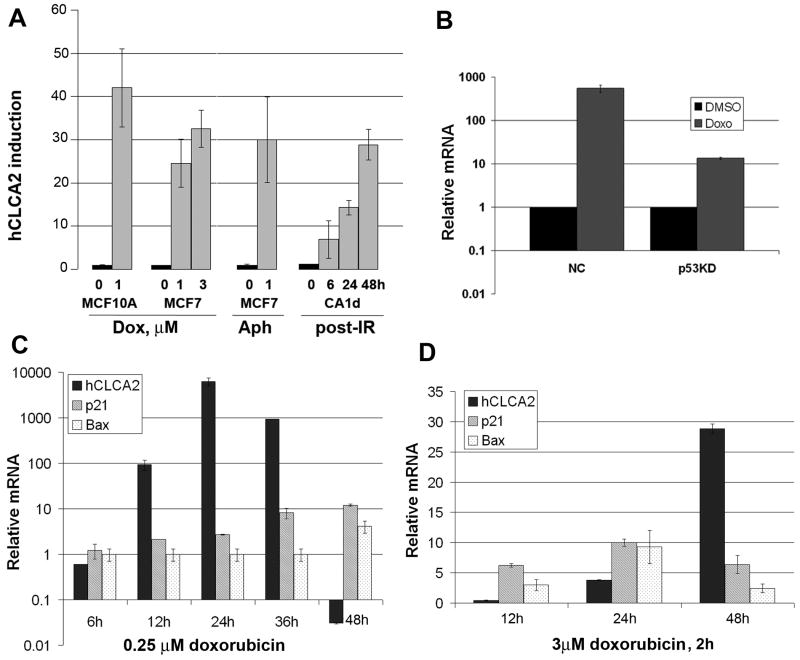
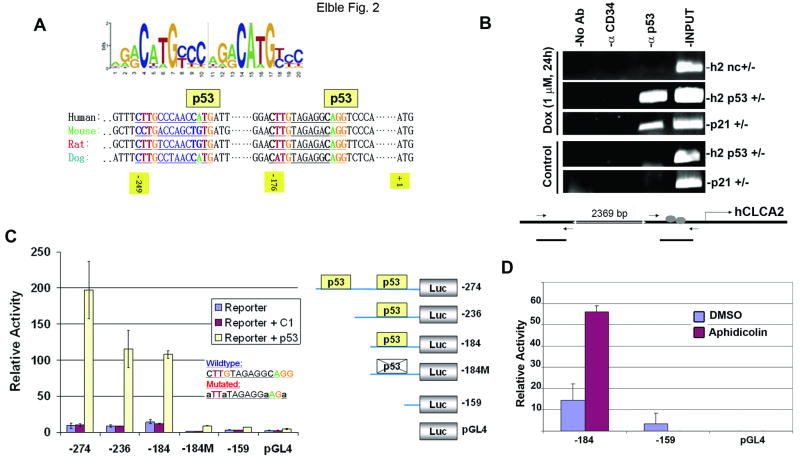
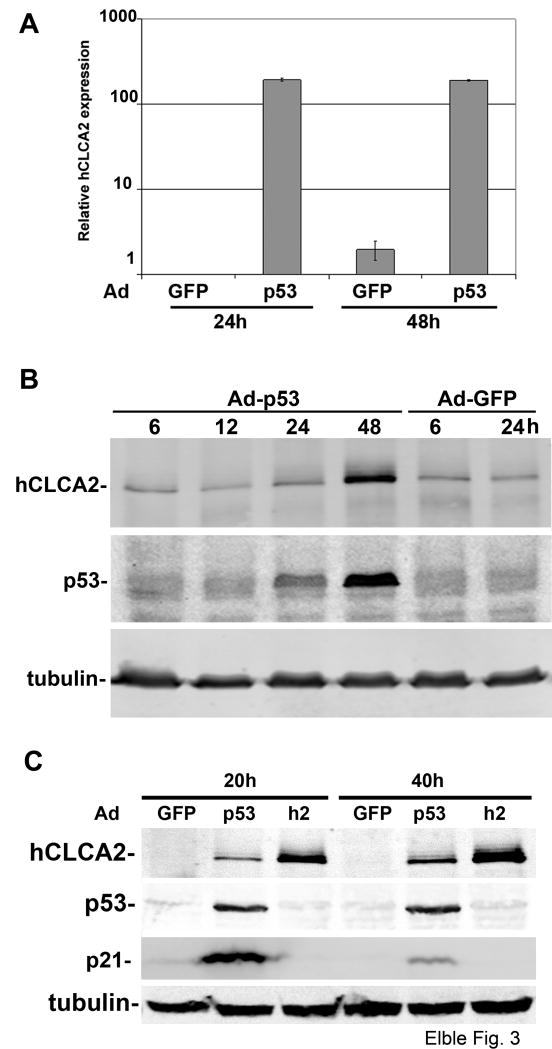
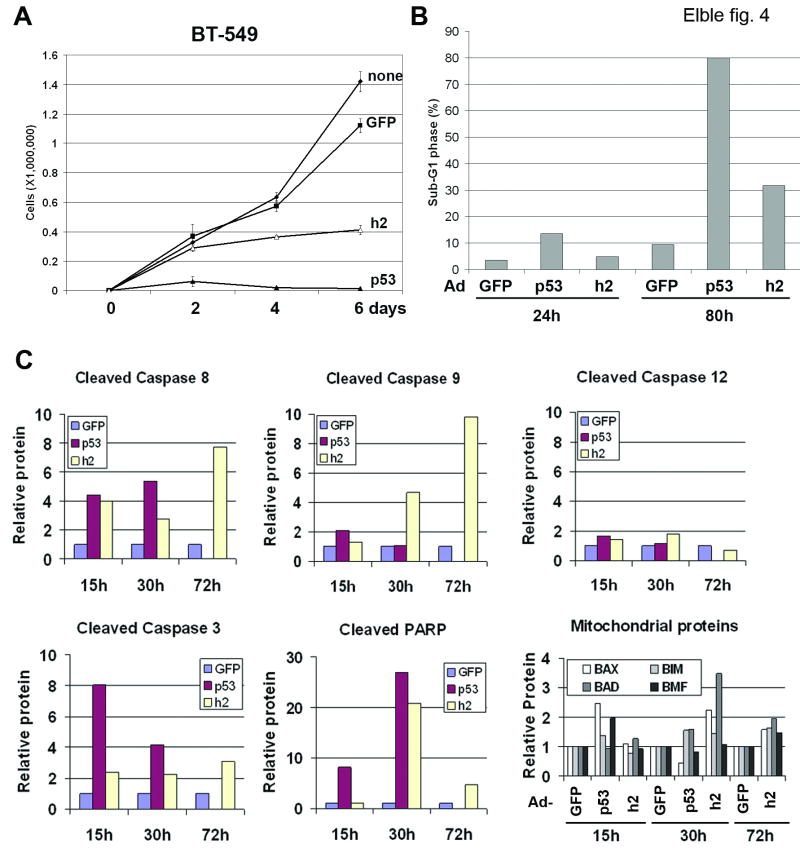
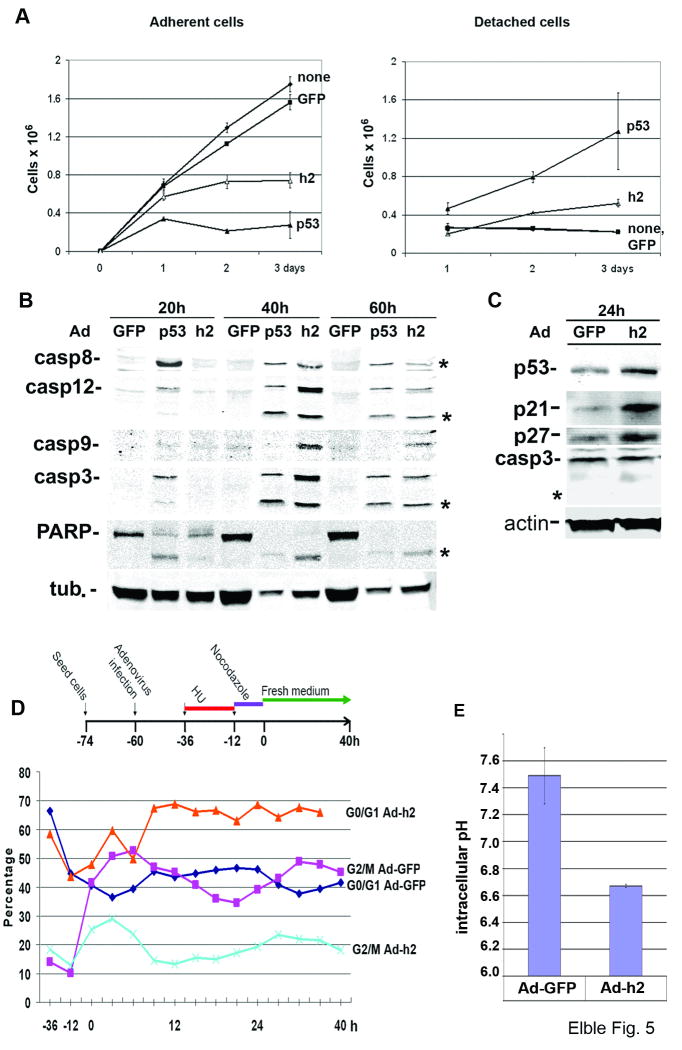
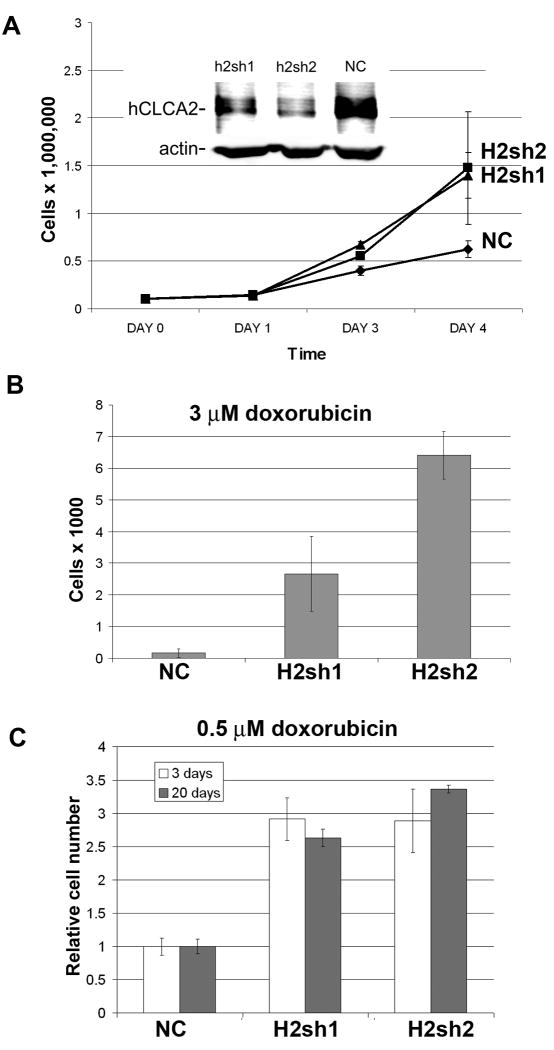
hCLCA2 is frequently down-regulated in breast cancer and is a candidate tumor suppressor gene. We show here that the hCLCA2 gene is strongly induced by p53 in response to DNA damage. Adenoviral expression of p53 induces hCLCA2 in a variety of breast cell lines. Further, we find that p53 binds to consensus elements in the hCLCA2 promoter and mutation of these sites abolishes p53-responsiveness and induction by DNA damage. Adenoviral transduction of hCLCA2 into immortalized cells induces p53, CDK inhibitors p21 and p27, and cell cycle arrest by 24 hours, and caspase induction and apoptosis by 40 hours postinfection. Transduction of the malignant tumor cell line BT549 on the other hand does not induce p53, p21, or p27 but instead induces apoptosis directly and more rapidly. Knockout and knockdown studies indicate that growth inhibition and apoptosis are signaled via multiple pathways. Conversely, suppression of hCLCA2 by RNA interference enhances proliferation of MCF10A and reduces sensitivity to doxorubicin. Gene expression profiles indicate that hCLCA2 levels are strongly predictive of tumor cell sensitivity to doxorubicin and other chemotherapeutics. Because certain Cl(-) channels are proposed to promote apoptosis by reducing intracellular pH, we tested whether, and established that, hCLCA2 enhances Cl(-) current in breast cancer cells and reduces pH to approximately 6.7. These results reveal hCLCA2 as a novel p53-inducible growth inhibitor, explain how its down-regulation confers a survival advantage to tumor cells, and suggest both prognostic and therapeutic applications.
Conflict of interest statement
Conflicts of interest: none
Figures
Similar articles
-
Loss of breast epithelial marker hCLCA2 promotes epithelial-to-mesenchymal transition and indicates higher risk of metastasis.Oncogene. 2012 Apr 26;31(17):2237-46. doi: 10.1038/onc.2011.392. Epub 2011 Sep 12. Oncogene. 2012. PMID: 21909135 Free PMC article.
-
Re-expression of detachment-inducible chloride channel mCLCA5 suppresses growth of metastatic breast cancer cells.J Biol Chem. 2004 Oct 1;279(40):41634-41. doi: 10.1074/jbc.M408334200. Epub 2004 Jul 30. J Biol Chem. 2004. PMID: 15292178
-
Defective p53 signaling in p53 wild-type tumors attenuates p21waf1 induction and cyclin B repression rendering them sensitive to Chk1 inhibitors that abrogate DNA damage-induced S and G2 arrest.Mol Cancer Ther. 2008 Feb;7(2):252-62. doi: 10.1158/1535-7163.MCT-07-2066. Mol Cancer Ther. 2008. PMID: 18281511
-
ING1 represses transcription by direct DNA binding and through effects on p53.Cancer Res. 2003 Sep 15;63(18):5785-92. Cancer Res. 2003. PMID: 14522900
-
Versatile functions of p53 protein in multicellular organisms.Biochemistry (Mosc). 2007 Dec;72(13):1399-421. doi: 10.1134/s0006297907130019. Biochemistry (Mosc). 2007. PMID: 18282133 Free PMC article. Review.
Cited by
-
Low expression of chloride channel accessory 1 predicts a poor prognosis in colorectal cancer.Cancer. 2015 May 15;121(10):1570-80. doi: 10.1002/cncr.29235. Epub 2015 Jan 20. Cancer. 2015. PMID: 25603912 Free PMC article.
-
Activation of nuclear factor-kappa B signalling promotes cellular senescence.Oncogene. 2011 May 19;30(20):2356-66. doi: 10.1038/onc.2010.611. Epub 2011 Jan 17. Oncogene. 2011. PMID: 21242976 Free PMC article.
-
The Discovery of Novel Biomarkers Improves Breast Cancer Intrinsic Subtype Prediction and Reconciles the Labels in the METABRIC Data Set.PLoS One. 2015 Jul 1;10(7):e0129711. doi: 10.1371/journal.pone.0129711. eCollection 2015. PLoS One. 2015. PMID: 26132585 Free PMC article.
-
Sparse multitask regression for identifying common mechanism of response to therapeutic targets.Bioinformatics. 2010 Jun 15;26(12):i97-105. doi: 10.1093/bioinformatics/btq181. Bioinformatics. 2010. PMID: 20529943 Free PMC article.
-
Prognostic value of chloride channel accessory mRNA expression in colon cancer.Oncol Lett. 2019 Sep;18(3):2967-2976. doi: 10.3892/ol.2019.10615. Epub 2019 Jul 15. Oncol Lett. 2019. PMID: 31404307 Free PMC article.
References
-
- Hanahan D, Weinberg RA. The hallmarks of cancer. Cell. 2000;100:57–70. - PubMed
-
- Garbe JC, Holst CR, Bassett E, Tlsty T, Stampfer MR. Inactivation of p53 function in cultured human mammary epithelial cells turns the telomere-length dependent senescence barrier from agonescence into crisis. Cell Cycle. 2007;6:1927–36. - PubMed
-
- Gewirtz DA. Growth arrest and cell death in the breast tumor cell in response to ionizing radiation and chemotherapeutic agents which induce DNA damage. Breast Cancer Res Treat. 2000;62:223–35. - PubMed
-
- El-Deiry WS. The role of p53 in chemosensitivity and radiosensitivity. Oncogene. 2003;22:7486–95. - PubMed
Publication types
MeSH terms
Substances
Grants and funding
LinkOut - more resources
Full Text Sources
Other Literature Sources
Medical
Research Materials
Miscellaneous
