. 2009 Aug 5;4(8):e6527.
doi: 10.1371/journal.pone.0006527.

Apoptosis of CD4+ CD25(high) T cells in type 1 diabetes may be partially mediated by IL-2 deprivation

Affiliations

Apoptosis of CD4+ CD25(high) T cells in type 1 diabetes may be partially mediated by IL-2 deprivation

Parthav Jailwala et al. PLoS One. .

Abstract

Background: Type 1 diabetes (T1D) is a T-cell mediated autoimmune disease targeting the insulin-producing pancreatic beta cells. Naturally occurring FOXP3(+)CD4(+)CD25(high) regulatory T cells (T(regs)) play an important role in dominant tolerance, suppressing autoreactive CD4(+) effector T cell activity. Previously, in both recent-onset T1D patients and beta cell antibody-positive at-risk individuals, we observed increased apoptosis and decreased function of polyclonal T(regs) in the periphery. Our objective here was to elucidate the genes and signaling pathways triggering apoptosis in T(regs) from T1D subjects.

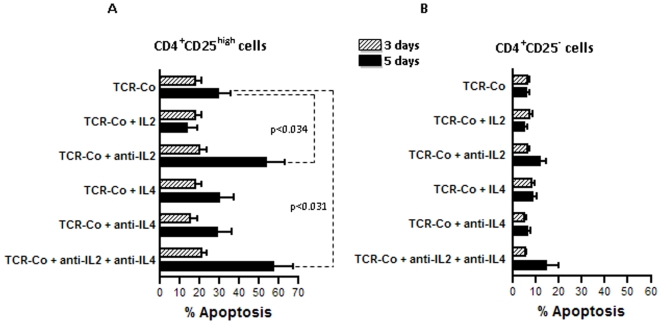
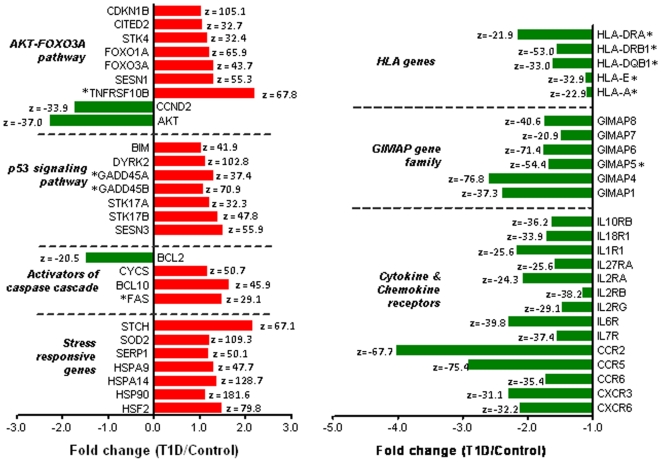
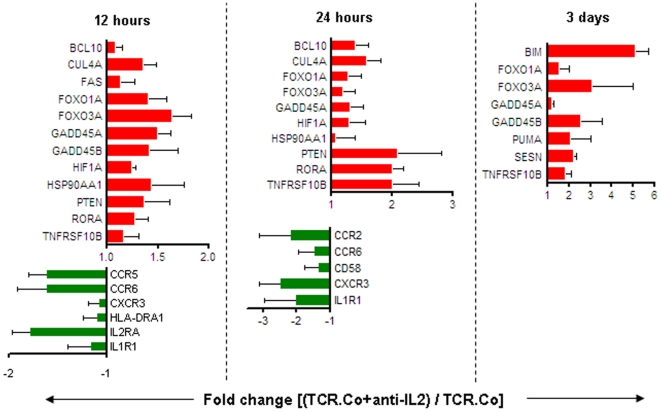
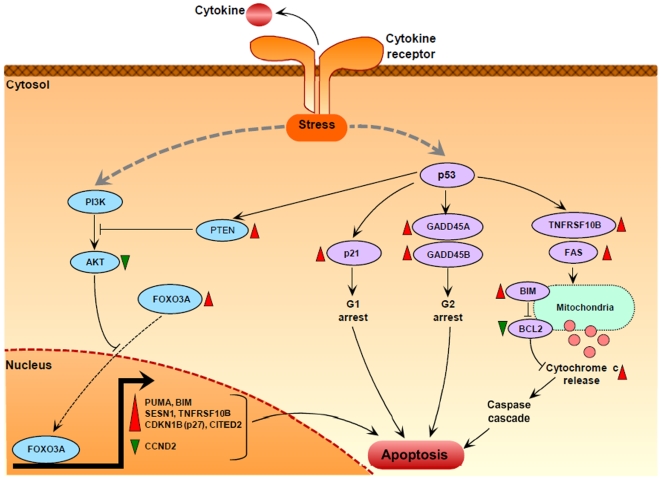
Principal findings: Gene expression profiles of unstimulated T(regs) from recent-onset T1D (n = 12) and healthy control subjects (n = 15) were generated. Statistical analysis was performed using a Bayesian approach that is highly efficient in determining differentially expressed genes with low number of replicate samples in each of the two phenotypic groups. Microarray analysis showed that several cytokine/chemokine receptor genes, HLA genes, GIMAP family genes and cell adhesion genes were downregulated in T(regs) from T1D subjects, relative to control subjects. Several downstream target genes of the AKT and p53 pathways were also upregulated in T1D subjects, relative to controls. Further, expression signatures and increased apoptosis in T(regs) from T1D subjects partially mirrored the response of healthy T(regs) under conditions of IL-2 deprivation. CD4(+) effector T-cells from T1D subjects showed a marked reduction in IL-2 secretion. This could indicate that prior to and during the onset of disease, T(regs) in T1D may be caught up in a relatively deficient cytokine milieu.

Conclusions: In summary, expression signatures in T(regs) from T1D subjects reflect a cellular response that leads to increased sensitivity to apoptosis, partially due to cytokine deprivation. Further characterization of these signaling cascades should enable the detection of genes that can be targeted for restoring T(reg) function in subjects predisposed to T1D.


Conflict of interest statement

Competing Interests: The authors have declared that no competing interests exist.

Figures

Figure 1
Figure 1. In T1D subjects, Tregs isolated from CD4+ T cells have reduced function and increased apoptosis.
Standard in vitro suppression assay included 25,000 responder CD4+CD25 T cells that were set up as single culture as well as with CD4+CD25high T cells in co-culture, both with added 25,000 of irradiated PBMCs (as antigen-presenting cells) which were stimulated with aCD3-coated beads (1 µg/ml) for 5 days. Ratio of responder and CD4+CD25high T cells was varied. Suppressors were seeded with APC in separate wells to measure their own proliferation in respond to the same stimulation. Bars are mean±SEM of three independent observations. (B) Suppression potential of isolated CD4+CD25high T-cells measured by an in vitro proliferation assay in T1D (n = 17) and control (n = 15) subjects. A standardized suppression assay was performed with 2.5×10⁴ CD4+CD25 effector T-cells (with 2.5×10⁴ irradiated PBMC -5000rad) in co-culture with CD4+CD25high T-cells at a 1∶10 ratio (CD4+CD25high: CD4+CD25), stimulated with aCD3 coated beads (1 ug/ml, 3 beads/per cell). Apoptosis results following YOPRO-1/7AAD staining for (C) CD4+CD25high (T1D: n = 16, controls: n = 25) and (D) CD4+CD25 T-cells (T1D: n = 15, controls: n = 17) are both presented as % apoptotic (YOPRO1+ve) amongst live cells (7AAD–ve).
Figure 2
Figure 2. Under conditions of IL-2 and IL-4 withdrawal, apoptosis in healthy Tregs mimics the increased apoptosis in Tregs from T1D subjects.
Apoptosis was measured in (A) healthy Tregs and (B) CD4+CD25 effector T-cells at 3 days and 5 days, in response to IL-2 and IL-4 deprivation as described in the methods. Overall, in response to IL-2- and IL-4- deprivation, Tregs show more apoptosis compared to effector T-cells. Further, within Tregs, withdrawal of IL-2 leads to a strong apoptosis response, compared to withdrawal of IL-4. Also, this difference in apoptosis was more prominent after 5 days of IL-2 withdrawal. The bars depict the mean±SEM of six independent observations.
Figure 3
Figure 3. Expression trends of differentially regulated apoptosis genes on the array.
This panel of genes shows the identity, functional grouping and the fold change of genes differentially regulated across T1D and control subjects (|z-score|>20). The red bars represent genes that are upregulated in T1D subjects compared to controls and the green bars represent genes that are downregulated in T1D subjects compared to controls. The fold changes are as reported by BGX analysis. The gene symbols with an asterisk (*) represent genes whose expression was confirmed on the microarray as well as by RT-PCR.
Figure 4
Figure 4. Confirmation of array results by RT-PCR.
Expression results for several genes in the AKT pathway and HLA genes were confirmed by RT-PCR. For genes in the AKT pathway, the expression value is a ratio of the average expression across T1D subjects (n = 5) to the average expression across control subjects (n = 5). For HLA Class II genes, the expression value is a ratio of the average expression across T1D subjects (n = 6) to the average across controls subjects (n = 8). For HLA Class I genes, the expression value is a ratio of the average across T1D subjects (n = 10) to the average across control subjects (n = 10). Genes for which the expression ratios were statistically significant (Mann-Whitney p≤0.05) are marked with an asterisk (*). Subjects are not the same as those used for expression profiling.
Figure 5
Figure 5. Under condition of IL-2 withdrawal, expression changes of key apoptosis and cytokine/chemokine genes in healthy Tregs are similar to those observed in Tregs from T1D subjects.
Expression changes in 32 selected genes were captured in healthy Tregs treated with aCD3+aCD28 with or without anti-IL-2, for indicated time points. The figure shows a subset of apoptosis and cytokine/chemokine receptor genes, whose expression trends in IL-2-deprived healthy Tregs were similar to those in Tregs from T1D subjects. Red bars indicate genes upregulated on IL-2 deprivation and green bars indicate genes downregulated on IL-2 deprivation in healthy Tregs. The bars depict the mean±SEM of three independent observations.
Figure 6
Figure 6. Putative cytokine deprivation mediated apoptosis signaling pathways in Tregs from T1D subjects.
In the absence of cytokines or growth factors, the stress-induced PI3K-AKT pathway and the p53 pathway are activated. Downregulation of PI3K and AKT through inhibition by PTEN leads to translocation of dephosphorylated FOXO3A into the nucleus. Nuclear FOXO3A activates several pro-apoptotic genes (PUMA, BIM, SESN1, TNFRSF10B, CDKN1B, CITED2) and represses CCND2 (a cell cycle gene) by direct transcriptional control. Modulation of these FOXO3A targets then leads to cell cycle arrest and apoptosis. On the other hand, activation of p53 further represses AKT via induction of PTEN, and also leads to a cascade of expression changes in several apoptosis genes. Activation of p21 and the two GADD45 genes leads to cell cycle arrest at the G1 and G2 phases respectively. Ligation of TRAIL with TNFRSF10B (TRAILR) and activation of FAS on the surface of Tregs triggers the extrinsic apoptosis pathway, leading to the release of cytochrome c from the mitochondria and activation of the caspase cascade. This complex signaling involving cytokine-deprivation mediated activation of both the intrinsic pathway as well as the extrinsic pathway leads to increased Treg apoptosis in T1D subjects. Genes with red triangles were upregulated, while genes with green triangles were downregulated in Tregs from T1D subjects (|z-score|>20 on the array). This pathway diagram is constructed using known gene-gene interactions from the literature, for those genes that were discussed in this study either on the array, RT-PCR or under conditions of IL-2-deprivation.

References

    1. Tisch R, McDevitt H. Insulin-dependent diabetes mellitus. Cell. 1996;85:291–297. - PubMed
    1. Donath MY, Storling J, Maedler K, Mandrup-Poulsen T. Inflammatory mediators and islet beta-cell failure: a link between type 1 and type 2 diabetes. J Mol Med. 2003;81:455–470. - PubMed
    1. Bacchetta R, Gambineri E, Roncarolo MG. Role of regulatory T cells and FOXP3 in human diseases. J Allergy Clin Immunol. 2007;120:227–235; quiz 236–227. - PubMed
    1. Putnam AL, Vendrame F, Dotta F, Gottlieb PA. CD4+CD25high regulatory T cells in human autoimmune diabetes. J Autoimmun. 2005;24:55–62. - PubMed
    1. Kukreja A, Cost G, Marker J, Zhang C, Sun Z, et al. Multiple immuno-regulatory defects in type-1 diabetes. J Clin Invest. 2002;109:131–140. - PMC - PubMed

Publication types

MeSH terms