. 2009 Oct;199(1):1-16.
doi: 10.1007/s00221-009-1956-5. Epub 2009 Aug 5.

Neural basis of postural instability identified by VTC and EEG

Affiliations

Neural basis of postural instability identified by VTC and EEG

Semyon Slobounov et al. Exp Brain Res. 2009 Oct.

Abstract

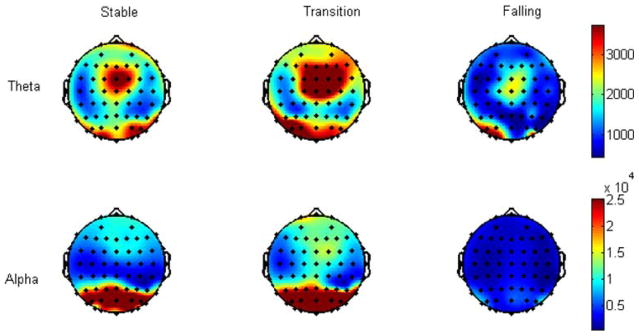
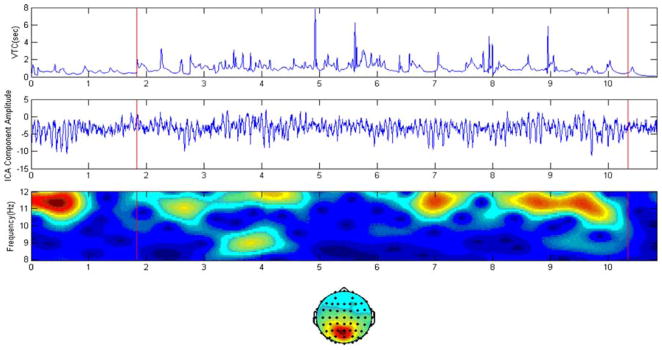
In this study, we investigated the neural basis of virtual time to contact (VTC) and the hypothesis that VTC provides predictive information for future postural instability. A novel approach to differentiate stable pre-falling and transition-to-instability stages within a single postural trial while a subject was performing a challenging single leg stance with eyes closed was developed. Specifically, we utilized wavelet transform and stage segmentation algorithms using VTC time series data set as an input. The VTC time series was time-locked with multichannel (n = 64) EEG signals to examine its underlying neural substrates. To identify the focal sources of neural substrates of VTC, a two-step approach was designed combining the independent component analysis (ICA) and low-resolution tomography (LORETA) of multichannel EEG. There were two major findings: (1) a significant increase of VTC minimal values (along with enhanced variability of VTC) was observed during the transition-to-instability stage with progression to ultimate loss of balance and falling; and (2) this VTC dynamics was associated with pronounced modulation of EEG predominantly within theta, alpha and gamma frequency bands. The sources of this EEG modulation were identified at the cingulate cortex (ACC) and the junction of precuneus and parietal lobe, as well as at the occipital cortex. The findings support the hypothesis that the systematic increase of minimal values of VTC concomitant with modulation of EEG signals at the frontal-central and parietal-occipital areas serve collectively to predict the future instability in posture.


Figures

Fig. 1
Fig. 1
Schematic representation of the virtual time-to-contact (VTC) calculation with respect to geometric stability boundary during a single leg stance. Some virtual trajectories projected from two representative initial centers of pressure coordinate points are outlined. The dotted line represents the center of pressure motion during a single trial. The dashed line represents the virtual trajectories at point initial positions of the center of pressure. Note, the virtual trajectory has a parabolic shape if the direction of the initial velocity and the acceleration vectors are not colinear. However, the virtual trajectory is linear, if the initial velocity and initial acceleration vectors have the same direction, or either of them is equal to zero
Fig. 2
Fig. 2
Dynamics of VTC time series including: a the stages of balance trial identified by segmentation analysis (see “Methods”); b evolution of minimal values of VTC; c evolution of mean values of VTC; d SD of VTC; time–frequency plot of VTC obtained by means of Morlet wavelet transform. Red vertical lines (top) outline the transition-to-instability phase. Red circles (top figure) represent deflection points
Fig. 3
Fig. 3
The topographic distributions of the grand mean spectral energy in low-theta (4–5 Hz) and -alpha (8–12 Hz) frequency bands in three stages, generated by the codes in EEGLAB toolbox. The figures are scaled within each frequency band for better comparison
Fig. 4
Fig. 4
A representative example of the first group ICA components a right leg and b left leg supporting condition. From top to bottom VTC time series; ICA components; time–frequency evolution of ICA component in gamma and theta bands. The vertical red lines indicate the transition between different stages of a postural task
Fig. 5
Fig. 5
A representative example of the second group ICA components: right leg supporting condition. From top to bottom VTC time series; ICA components; time–frequency evolution of ICA component in alpha band. The vertical red lines indicate the transition between different stages of a postural task
Fig. 6
Fig. 6
Brain sources of associated scalp maps of the first group ICA components computed by LORETA (red areas show LORETA standardized values 2.5 times greater than the standard deviation in the LORETA spatial solution). a Right leg stance condition; b left leg stance condition. Note, the common source of the first group of ICA components was located at the cingulate gyrus and the limbic lobe (Broadmann’ area # 24)
Fig. 7
Fig. 7
Brain sources of associated scalp maps of the second group ICA components computed by LORETA (red areas show LORETA standardized values 2.5 times greater than the standard deviation in the LORETA spatial solution). Note, the source of the second group of ICA components was located at the junction of the precuneus and the parietal lobe (Broadmann’ area # 7). Only the right leg stance condition is shown, since no differences were observed between leg conditions
Fig. 8
Fig. 8
Representative example of the time series of the center of pressure (COP) data along the lateral direction, X (a); and anterior–posterior direction, Y (b) axes. Standard deviation (SD) of COP and time–frequency plots of COP time series were obtained by means of Morlet wavelet transform. Note, no discernable features allowing separation of stable stage and transition to instability leading to falling can be observed

Similar articles

Cited by

References

    1. Aftanas LI, Pavlov SV, Reva NV, Varlamov AA. Trait anxiety on the EEG theta band power changes during appraisal of threatening and pleasant visual stimuli. Int J Psychophysiol. 2003;50(3):205–212. - PubMed
    1. Barin K. Dynamic posturagraphy analysis of error in force plate measurement of postural sway. IEEE Eng Med Biol. 1992;11:52–56.
    1. Basar E, Basar-Eroglu T, Demiralp T, Schurmann M. Time and frequency analysis of the brain’s distributed gamma band system. IEEE Eng Med Biol. 1995;14:400–410.
    1. Boiten F, Sergeant J, Geuze R. Event-related desynchronization: the effect of energetic and computational demands. Electroenceph Clin Neurophysiol. 1992;81(4):302–309. - PubMed
    1. Botvinick M, Braver T, Barch D, Carter C, Cohen J. Conflict monitoring and cognitive control. Psych Rev. 2001;108:624–652. - PubMed

Publication types

MeSH terms