. 2009 Aug;30(3):449-63.
doi: 10.1111/j.1460-9568.2009.06838.x. Epub 2009 Jul 28.

Altered volume and hemispheric asymmetry of the superficial cortical layers in the schizophrenia planum temporale

Affiliations

Altered volume and hemispheric asymmetry of the superficial cortical layers in the schizophrenia planum temporale

John F Smiley et al. Eur J Neurosci. 2009 Aug.

Abstract

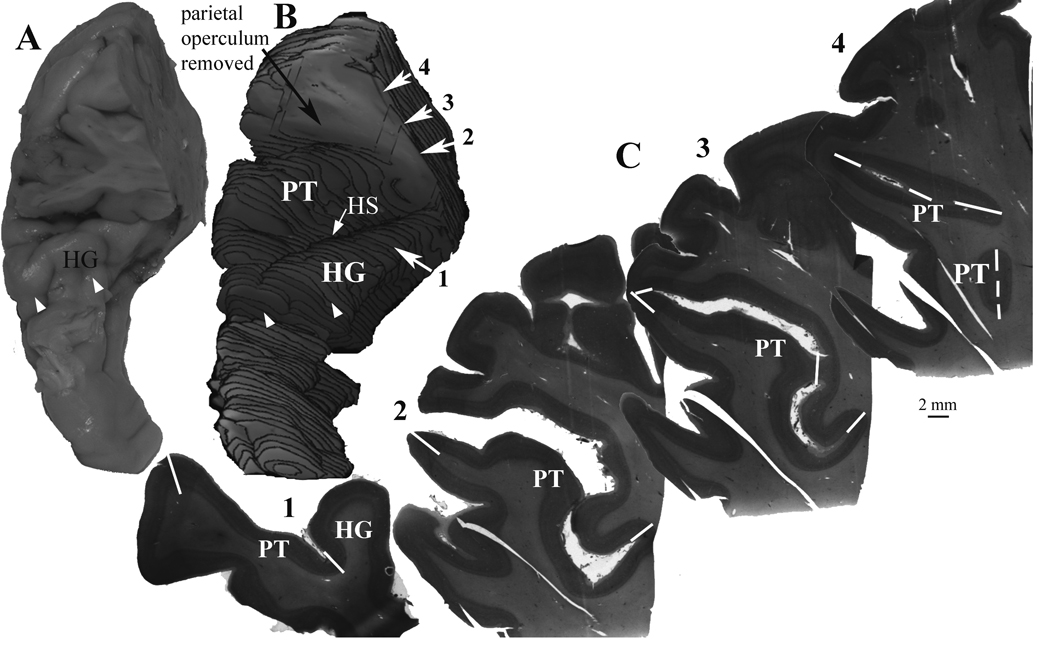
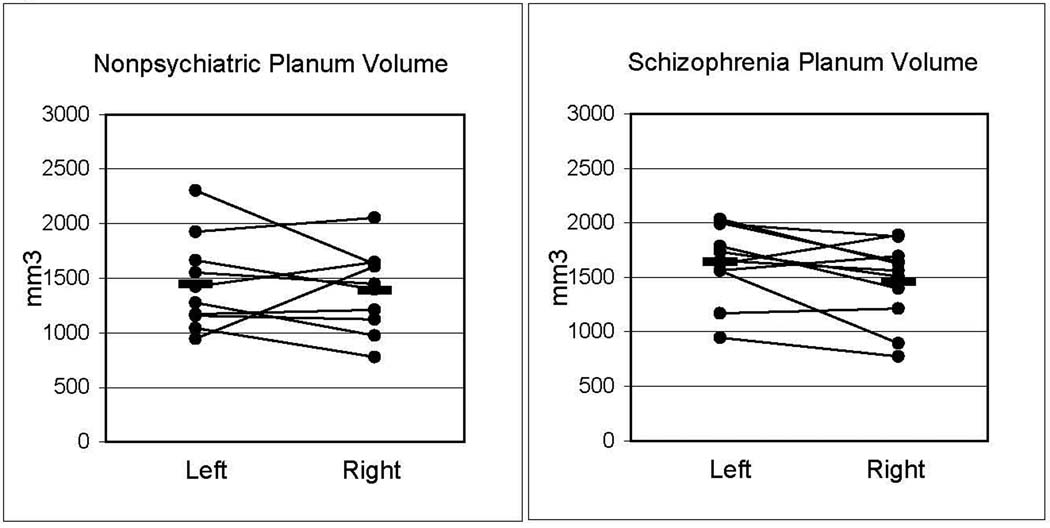
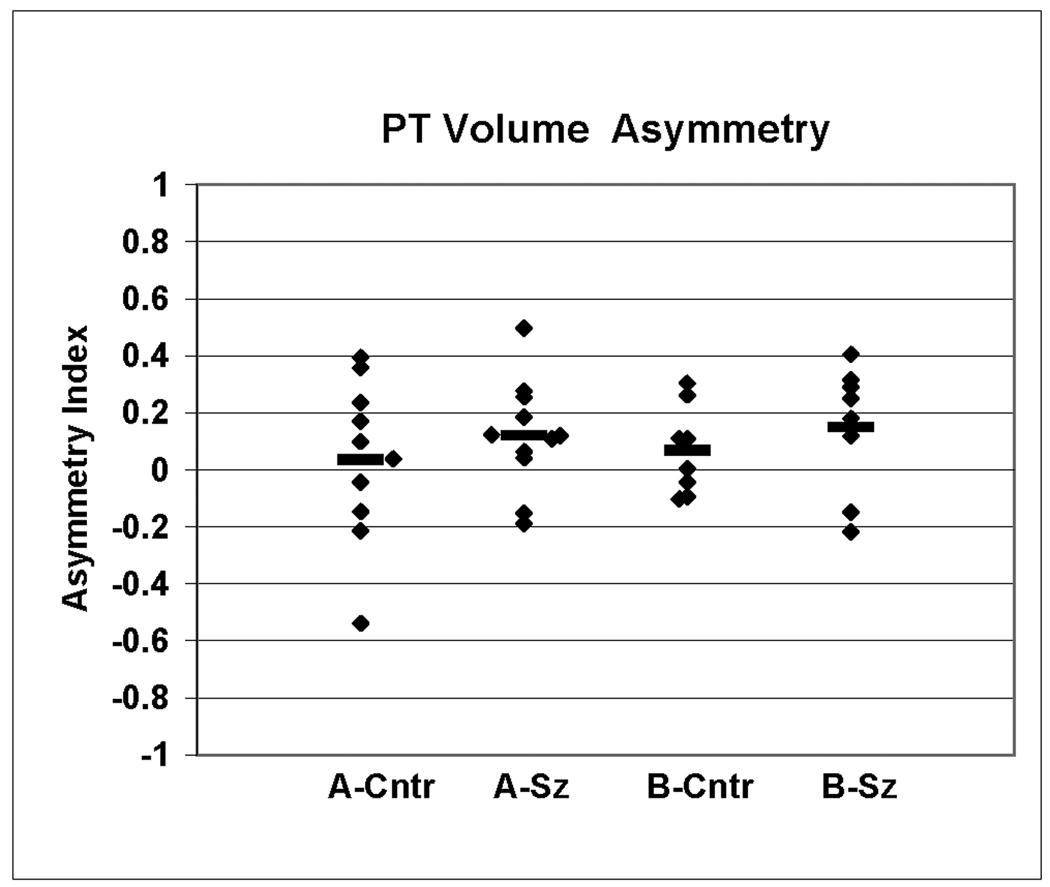
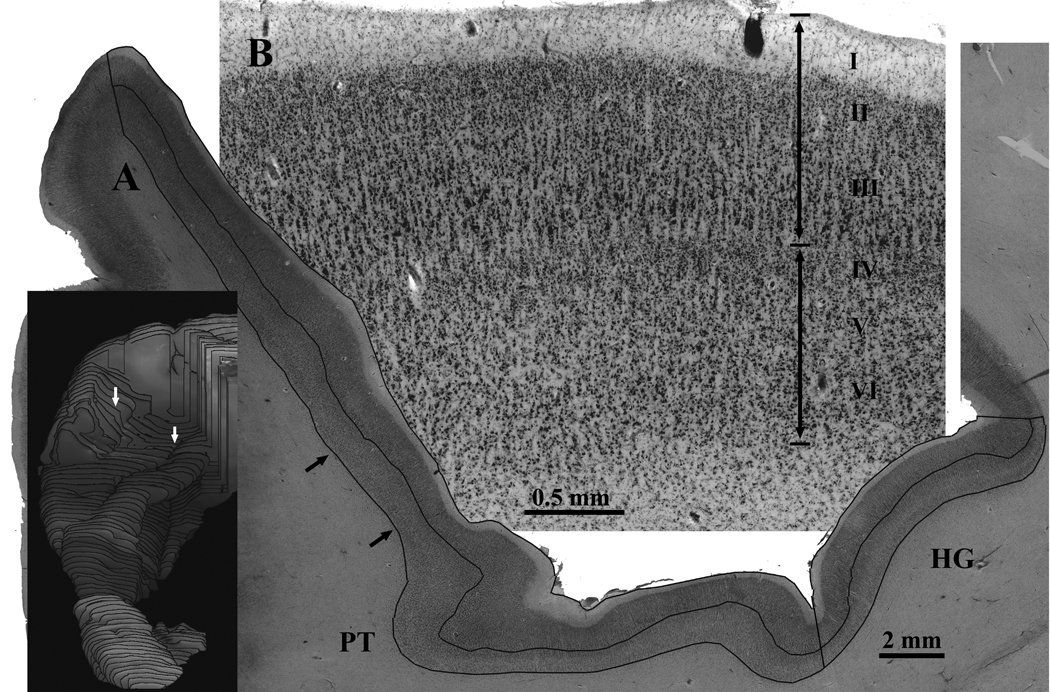
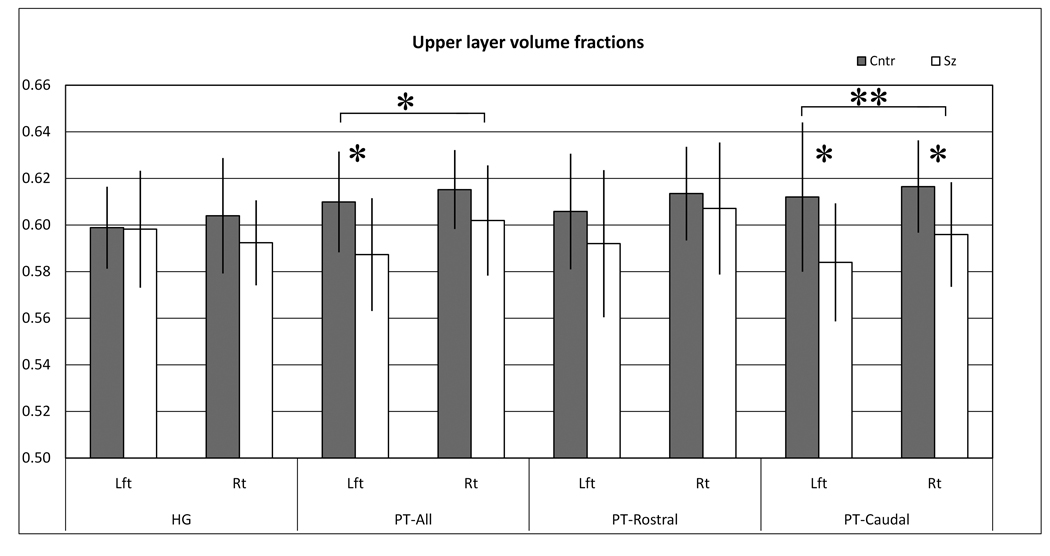
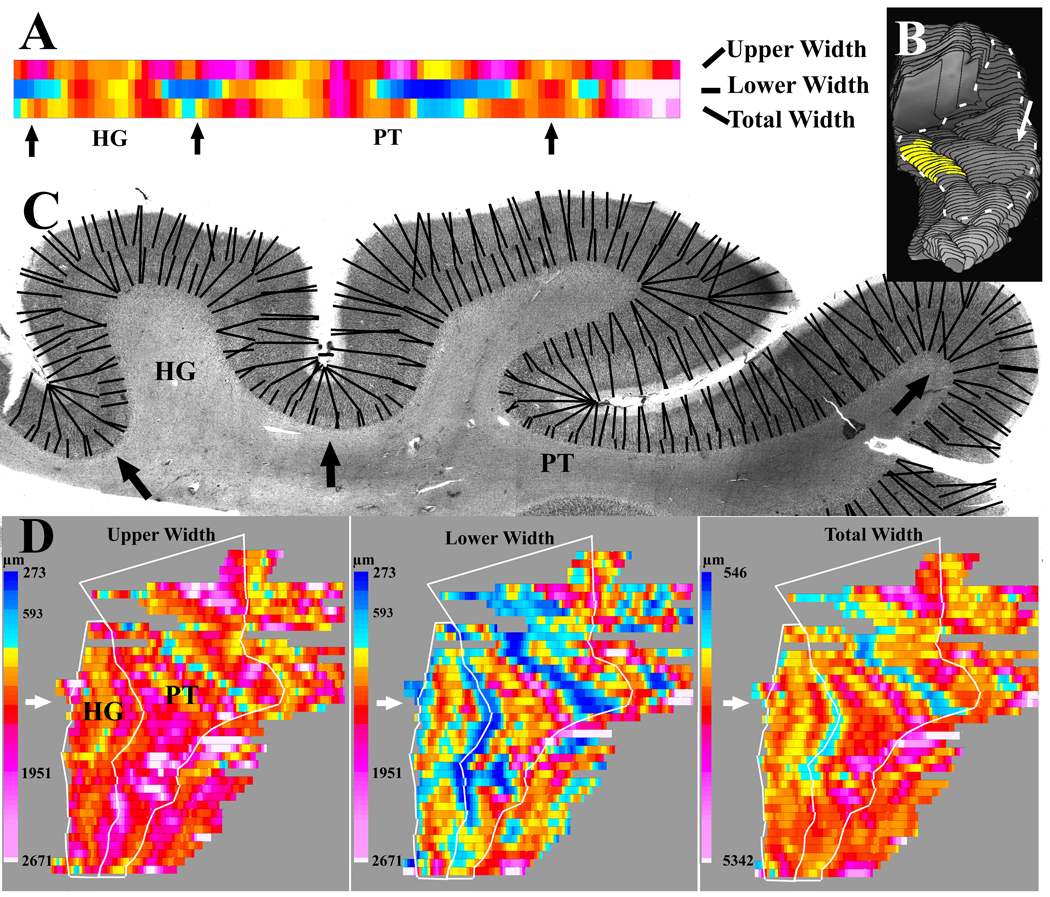
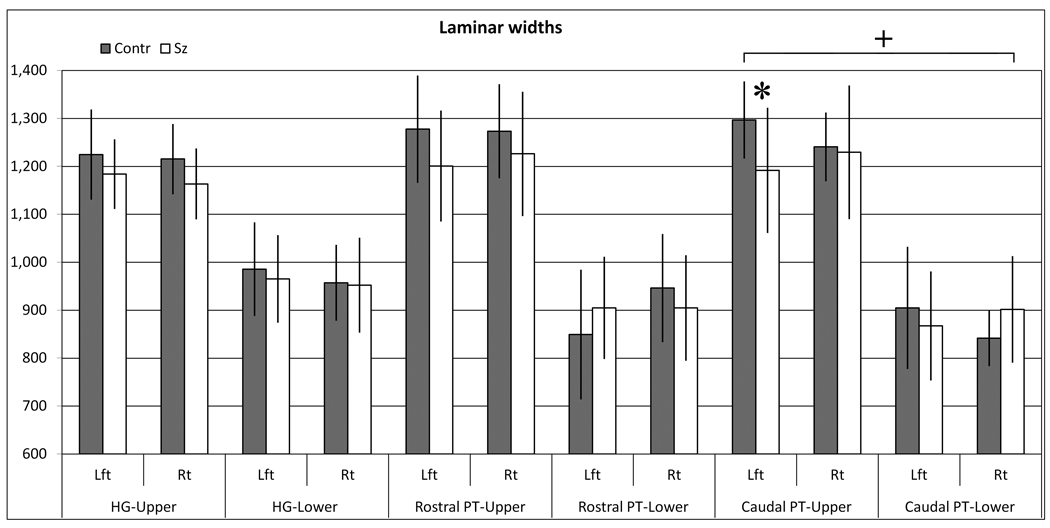
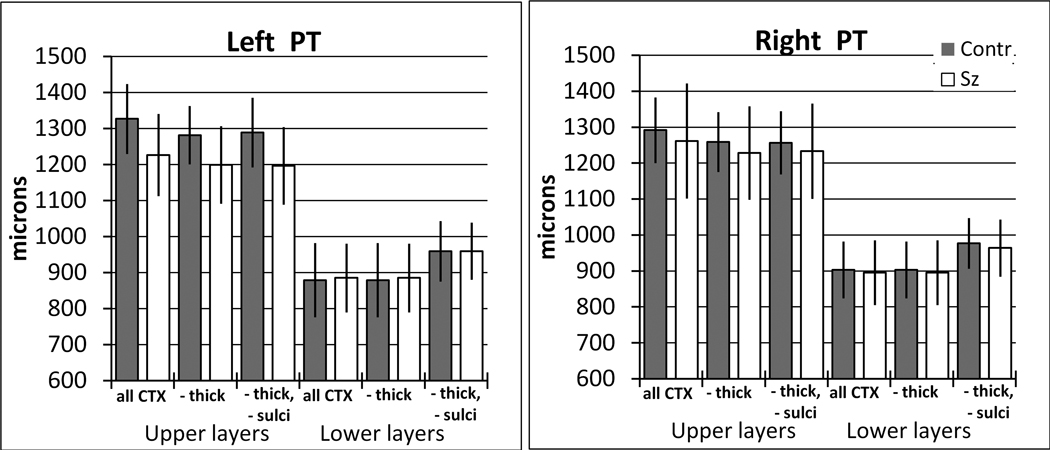
In vivo structural MRI studies in schizophrenia auditory cerebral cortex have reported smaller volumes and, less consistently, have reported altered hemispheric asymmetry of volumes. We used autopsy brains from 19 schizophrenia and 18 nonpsychiatric male subjects to measure the volume asymmetry of the planum temporal (PT). We then used the most recently autopsied 11 schizophrenia and 10 nonpsychiatric brains to measure the widths and fractional volumes of the upper (I-III) and lower (IV-VI) layers. Measurements of whole PT gray matter volumes did not show significant changes in schizophrenia. Nevertheless, laminar volume measurements revealed that the upper layers of the PT comprise a smaller fraction of the total cortex in schizophrenia than in nonpsychiatric brains. Subdivision of the PT showed that this change was especially prominent caudally, beyond Heschl's gyrus, whereas similar but less pronounced changes were found in the rostral PT and Heschl's gyrus. Complementary measures of laminar widths showed that the altered fractional volume in the caudal left PT was due mainly to approximately 8% thinner upper layers. However, the caudal right PT had a different profile, with thicker lower layers and comparatively unchanged upper layers. Thus, in the present study, laminar measurements provided a more sensitive method for detecting changes than measurement of whole PT volumes. Besides findings in schizophrenia, our cortical width measurements revealed normal hemispheric asymmetries consistent with previous reports. In schizophrenia, the thinner upper layers of the caudal PT suggest disrupted corticocortical processing, possibly affecting the multisensory integration and phonetic processing of this region.


Figures

Figure 1
Figure 1
An example of the methods used to measure the gray matter volume of the planum temporale (PT). A) The full extent of the PT and Heschl’s gyrus was dissected from each hemisphere. The parietal operculum was also included to prevent loss of any part of the caudal end of the lateral sulcus. The perspective in this image is from the anterior and dorsal view. B) For each hemisphere, a 3-dimensional reconstruction was made from video images of the block face during sectioning. Reconstructions were made from the every 12th section, using the same series of sections used for Nissl staining. The parietal operculum was removed from the reconstruction in order to view the PT surface. Heschl’s sulcus (HS) separates Heschl’s gyrus from the PT. The rostral end of Heschl’s gyrus is typically seen as an obvious end of the gyrus (white arrowheads in A and B). C) Nissl stained sections were digitally imaged, and the volume of cortex extending from Heschl’s gyrus (HG), or from the fundus of the lateral sulcus, to the lateral crest of the lateral sulcus was included as the PT. The white lines (solid and dashed) show the borders of the PT that were used to delimit the PT from adjacent structures, as described in the Methods section. Care was taken to include all cortex extending to the terminal end of the lateral sulcus. In this example, the numbered sections are the same as the corresponding sections in B.
Figure 2
Figure 2
Measured gray matter volumes of the PT, from sample A, did not show significant group or hemispheric differences.
Figure 3
Figure 3
Hemispheric asymmetry of the PT gray matter volumes were expressed as an asymmetry index (AI) = (left−right)/(0.5×(left+right)) for each subject. Values for schizophrenia and control brains are shown separately for samples A and B.
Figure 4
Figure 4
An example is shown of the methods used to measure the fractional volumes of the upper and lower layers. A) High resolution video montages were made of every 0.96 mm spaced Nissl stained section through Heschl’s gyrus (HG) and the planum temporale (PT). On each montage, interactive software was used to outline the borders of the pial surface, the border between layers 3 and 4, and the border between cortex and white matter. The upper layer volume fraction for each region of interest (PT or HG) was the sum of the areas of the upper layers divided by the total sum of the upper and lower areas. Small black arrows show the location of the cortex displayed in B. The inset shows the location of the section displayed in A (white arrows). B) A piece of the section from A is shown at higher magnification. The upper boundary of layer IV was used to subdivide the upper layers (I–III) from lower layers (IV–VI).
Figure 5
Figure 5
Graphs display the upper layer fractional volumes in each region of interest. The fractional volume in each region was the total volume of the upper layers divided by the sum of the upper and lower layers. Diagnostic group significance are denoted * = p>0.05, **=p<0.01. Values are mean +/− S.D.
Figure 6
Figure 6
An example is shown of the methods used to measure the widths of the upper and lower layers. A) The output from width measurements of individual sections was displayed as 3 linear arrays of colored rectangles. The array length corresponded to the length of layer 4, and each rectangle corresponded to an average of the 2 nearest width measurements. Arrows show the corresponding location on the histological section in B. The color scales are shown in C. B) The source of the histological section from A (white arrow) is shown in a reconstruction of the PT in this sample. For purposes of orientation, the location of the cytoarchitectonically identified primary auditory cortex on HG is highlighted in yellow. C) Widths were measured between the same laminar borders used for fractional volume measurements. Evenly spaced points along each border were selected, and the shortest line distance to the nearest adjacent border (black lines) was determined. The dashed white line outlines the extent of the PT and HG used for width measurements. D) For each hemisphere, 3 sequential flat maps are produced showing the upper widths, lower widths, and total widths. Sequential output from adjacent sections are aligned to make a flat map of the entire HG and PT. On each map, the white arrow shows the output from the section displayed in A and B. The white lines show the borders of the PT and HG that were outlined to summarize the average width of these regions of interest. The thinning at the fundus of sulci is seen most clearly in the map of the lower layer widths.
Figure 7
Figure 7
Graphs display the widths of upper layers (I–III) or lower layers (IV–VI) in each region of interest. For clarity, the combined rostral and caudal PT (“PT-All”) widths are not shown, but are presented in Figure 8 and Table 4. * = p>0.05, and + = <0.01 group × hemisphere difference. Values are median +/− S.D.
Figure 8
Figure 8
Alternate analyses of cortical widths showed that the group and hemispheric differences were largely unaffected by removal of tangentially sectioned cortex, or by removal of thin cortex at the depth of sulci. In this example, different width measurements are shown from the upper and lower layers of the left and right whole PT. The bars labeled “all cortex” are measurements that did not remove tangentially cut cortex. Bars labeled “-thick” were from measurements in which any length of cortex with upper or lower layers greater than 1950 microns wide was omitted from the analysis, and this was the method used for the main analysis described in the text. The effect of this omission was to decrease the apparent width of cortex, especially in the upper layers. Bars labeled “-thick, -sulci” additionally omitted all cortex that had lower layers less than 593 microns thick. The effect of this omission was to increase the apparent lower layer width. Dark bars are nonpsychiatric, and white bars are schizophrenia samples. Values are median +/− S.D.

References

    1. Akbarian S, Grusser OJ, Guldin WO. Corticofugal connections between the cerebral cortex and brainstem vestibular nuclei in the macaque monkey. J Comp Neurol. 1994;339:421–437. - PubMed
    1. Anderson B, Southern BD, Powers RE. Anatomic asymmetries of the posterior superior temporal lobes: a postmortem study. Neuropsychiatry, Neuoropsychology and Behavioral Neurology. 1999;12:247–254. - PubMed
    1. Antal A, Baudewig J, Paulus W, Dechent P. The posterior cingulate cortex and planum temporale/parietal operculum are activated by coherent visual motion. Vis Neurosci. 2008;25:17–26. - PubMed
    1. Beasley CL, Chana G, Honavar M, Landau S, Everall IP, Cotter D. Evidence for altered neuronal organisation within the planum temporale in major psychiatric disorders. Schizophr Res. 2005;73:69–78. - PubMed
    1. Beasley CL, Zhang ZJ, Patten I, Reynolds GP. Selective deficits in prefrontal cortical GABAergic neurons in schizophrenia defined by the presence of calcium-binding proteins. Biol Psychiatry. 2002;52:708–715. - PubMed

Publication types