. 2010 Jun;14(6B):1569-93.
doi: 10.1111/j.1582-4934.2009.00868.x. Epub 2009 Jul 28.

Podosome-like structures of non-invasive carcinoma cells are replaced in epithelial-mesenchymal transition by actin comet-embedded invadopodia

Affiliations

Podosome-like structures of non-invasive carcinoma cells are replaced in epithelial-mesenchymal transition by actin comet-embedded invadopodia

Minna Takkunen et al. J Cell Mol Med. 2010 Jun.

Erratum in

  • J Cell Mol Med. 2010 Aug;14(8):2185

Abstract

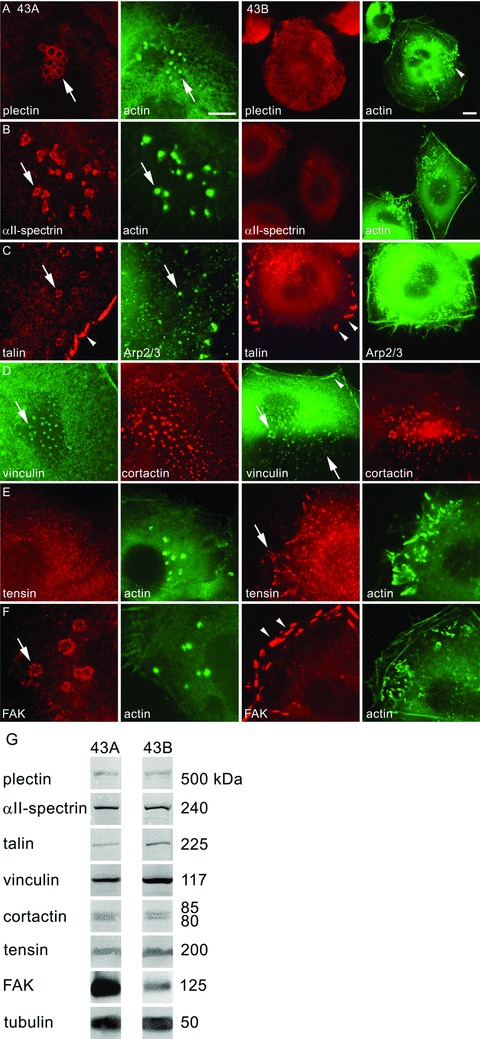
Podosomes and invadopodia are actin-based structures at the ventral cell membrane, which have a role in cell adhesion, migration and invasion. Little is known about the differences and dynamics underlying these structures. We studied podosome-like structures of oral squamous carcinoma cells and invadopodia of their invasive variant that has undergone a spontaneous epithelial-mesenchymal transition (EMT). In 3D imaging, podosomes were relatively large structures that enlarged in time, whereas invadopodia of invasive cells remained small, but were more numerous, degraded more extracellular matrix (ECM) and were morphologically strikingly different from podosomes. In live-cell imaging, highly dynamic, invadopodia-embedded actin tails were frequently released and rocketed through the cytoplasm. Resembling invadopodia, we found new club-ended cell extensions in EMT-experienced cells, which contained actin, cortactin, vinculin and MT1-matrix metalloproteinase. These dynamic cell extensions degraded ECM and, in field emission scanning electron microscopy, protruded from the dorsal cell membrane. Plectin, alphaII-spectrin, talin and focal adhesion kinase immunoreactivities were detected in podosome rings, whereas they were absent from invadopodia. Tensin potentially replaced talin in invadopodia. Integrin alpha(3)beta(1) surrounded both podosomes and invadopodia, whereas integrin alpha(v)beta(5) localized only to invadopodia heads. Pacsin 2, in conjunction with filamin A, was detected early in podosomes, whereas pacsin 2 was not found in invadopodia and filamin A showed delayed accumulation. Fluorescence recovery after photobleaching indicated faster reorganization of actin, cortactin and filamin A in podosomes compared to invadopodia. In conclusion, EMT affects the invasion machinery of oral squamous carcinoma cells. Non-invasive squamous carcinoma cells constitutively organize podosomes, whereas invasive cells form invadopodia. The club-ended cell extensions, or externalized invadopodia, are involved in ECM degradation and maintenance of contact to adhesion substrate and surrounding cells during invasion.


Figures

Fig 1
Fig 1
Wound-healing, random cell migration and cell invasion assays of oral SCC 43A and 43B cells. In wound-healing experiments, rhodamine phalloidin-labelled 43A cells presented tight cell–cell junctions but no migration after 2 hrs. After 24 hrs, 43A cells showed some migration as a homogenous front and maintained a close relationship with their neighbouring cells (A, B). Dot-like accumulations of actin that resembled podosomes could be seen in 43A cells (arrows). In contrast, EMT-experienced 43B cells showed membrane protrusions towards the wound area after 2 hrs (C). After 24 hrs, elongated 43B cells migrated as individual cells and presented long, filamentous cell extensions with actin accumulations (D, H, arrows). Time-lapse imaging of random cell migration of fluorophore-labelled cells (E–G) showed that the trajectory length of 43B cells was on average 339 ± 23.7 μm in 10 hrs, whereas in 43A cells it was only 66 ± 9.0 μm (E). The trajectories of 43B cells were fivefold longer than those of 43A cells. The migrated distance of both cells increased linearly with time (F). The ratio of the trajectory length and the distance between the start and end-point was significantly lower in 43B cells, indicating higher directionality compared with 43A cells. ***P < 0.0001; **P= 0.0050. In 24-hr invasion assay, 43A cells did not invade through the Matrigel (I). In contrast, 43B cells invaded through the Matrigel to the lower Boyden chambers and presented dot-like actin accumulations (J, arrows). Filter pores can be seen in photographs (I) and (J) as round rings. In 48-hr assay, the percentage of cells showing actin-based structures was high in both cells regardless of the ECM substrate. The only difference was that in 43B cells, the amount of actin-based structures was diminished when the cells were seeded on fibronectin compared with glass (K). #P < 0.05. Scale bars: 20 μm.
Fig 2
Fig 2
Morphology of podosome-like structures and invadopodia in oral SCC 43A and 43B cells. The cells were seeded on fluorescein-conjugated ECM for 2–5 hrs, labelled with rhodamine phalloidin, and analysed with confocal microscope. 43A cells showed round, dot-like podosomes at 2 hrs after seeding (A, arrows), which produced ECM degradation beneath them. In 43B cells, actin accumulated as multiple, irregular, punctate structures, which also colocalized with the fluorescence-devoid ECM cavities (B, arrows). At 2 hrs, filopodia-like cell membrane extensions (arrowheads) were seen in 43B cells that matured at 5 hrs into club-ended, actin-containing cell extensions (C, arrowheads). Also these club-ended extensions localized to the of fluorescein-conjugated ECM cavities. EGFP-actin transfections and phase contrast images showed the complex invadopodia and club-ended extensions in 43B cells (D). Scale bar: 20 μm.
Fig 3
Fig 3
Field emission scanning electron microscopy of 43A and 43B cells. In FESEM, 43A cells presented a round, flat, epithelioid phenotype with broad lamellipodia (A, arrows). In contrast, 43B cells were covered with multiple and complex membrane projections (B–D). These cell extensions appeared to originate from granular buds at their dorsal cell membrane (C, arrows). In some occasions, the tips of the extensions were broad and flat (B–D), differing from those of, e.g. microspikes and filopodia. Scale bars: (A): 100 μm, (B): 10 μm, (C) and (D): 1 μm.
Fig 4
Fig 4
Localization of plectin, αII-spectrin, talin, vinculin, tensin and FAK, in 43A podosome-like structures and 43B invadopodia. Plectin immunoreactivity localized in peripheral rings of podosomes in EGFP-actin transfected 43A cells (A, arrow). However, in 43B cells, plectin did not localize to invadopodia that were characterized by EGFP-actin accumulation (arrowhead), but associated with cytoplasmic filaments. αII-spectrin immunoreactivity was found in the peripheral rings surrounding the podosome cores (B, arrow). In 43B cells, αII-spectrin was found as diffuse cell surface immunoreactivity. In double-labelling with Arp 2/3 (C), talin was detected both in podosome rings (arrow) and focal adhesions (arrowhead) in 43A cells, whereas in 43B cells, talin was found only in focal adhesions (arrowheads). Vinculin colocalized in double-labelling with cortactin in podosome cores, invadopodia and club-ended cell extensions (D, arrows). Vinculin immunoreactivity was found also in focal adhesions in 43B cells (arrowhead). In 43A cells, tensin reactivity was diffuse, but in 43B cells, it localized to invadopodia (E, arrow). FAK was confined to the peripheral ring of podosomes (F, arrow), but in 43B cells it localized only to focal adhesions (arrowheads). Scale bars: 10 μm. In Western blots of 43A and 43B cell lysates, the protein levels of plectin, αII-spectrin, talin, vinculin, cortactin and tensin were equal (G). In immunoprecipitation with Mab against FAK followed by Western blot with MAb against phosphotyrosine, FAK expression levels were somewhat stronger in 43A cells compared with 43B cells. Tubulin was used as a loading control.
Fig 5
Fig 5
Localization of integrin α3, β1, αv and β5 subunits. Immunoreactivity for integrin α3 subunit was detected diffusely at the cell surface, but especially in the podosome ring of EGFP-actin transfected 43A cells (A, arrow). In 43B cells, integrin α3 subunit localized at the plasma membrane enveloping the invadopodia and cell extensions (arrow). Integrin β1 subunit, a potential binding partner of integrin α3 subunit, also localized in the podosome ring in 43A cells and enveloped the invadopodia heads and tails in 43B cells (B, arrow). Integrin αv subunit immunoreactivity was not found in 43A podosomes (C), but localized to focal adhesions (arrowhead). However, in EGFP-transfected 43B cells, integrin αv subunit immunoreactivity was found at, or occasionally around (arrow) the invadopodia heads attached to the plasma membrane. Integrin β5 subunit reactivity was faint in 43A cells and absent in podosomes (D), whereas in 43B cells, it was found strictly at the actin head-plasma membrane interface (arrow). Scale bars: 10 μm. Immunoprecipitations with MAbs against integrin α3 (E, lanes 1, 6) and β1 (lanes 2, 7) subunits showed strong bands of integrin α3β1 in both cells, indicating heterodimer formation. MAb against αv detected only a single band corresponding to the size of integrin αv in 43A cells (lane 3), but detected two strong bands of integrin αvβ5 heterodimer in 43B cells (lane 8). MAb against integrin β5 subunit showed again a single band in 43A cells, but two strong bands of αvβ5 in 43B cells (lanes 4, 9). Lanes 5, 10: negative controls without primary antibody.
Fig 6
Fig 6
Localization of pacsin 2, filamin A and MT1-MMP in 43A podosome-like structures and 43B invadopodia. Confocal images showed membrane-bending protein pacsin 2 immunoreactivity at the podosome rings that were associated also with ECM degradation cavities after 2 hrs of plating (A). Pacsin 2 immunoreactivity was not found in or near invadopodial structures (B). Pacsin-binding protein filamin A was found in 43A podosome cores after 2 hrs, but it accumulated to invadopodia only after 15 hrs of plating (C, D, arrows). Even then, filamin A was detected only in a small proportion of invadopodia. EGFP-filamin A transfections showed that filamin A and pacsin 2 colocalized in 43A podosomes, but the transfections did not result in pacsin 2 expression in 43B invadopodia (E). MT1-MMP was found as dot-like accumulations in the proximity of podosomes and invadopodia and in association with ECM cavities (F). MT1-MMP also localized to cell extensions of 43B cells, indicating that they possess gelatinase activity and thus ECM degradation capability. Scale bars: 20 μm. Western blots indicated the presence of pacsin 2, filamin A and MT1-MMP in both 43A and 43B cells (G). Tubulin was used as a loading control.
Fig 7
Fig 7
Podosome and invadopodia size and ECM degradation activity. 3D reconstructions of confocal images obtained from cells grown on fluorescein-conjugated gelatin showed dome-like, wide podosome columns in phalloidin-labelled 43A cells, whereas invadopodia in 43B cells were narrow funnel-shaped structures (A, B). Podosomes and invadopodia protruded through the fluorescein-labelled ECM (C, D). Nucleus, blue; gelatin, green; isosurface rendering of actin structures, grey; actin, red. Podosomes increased their relative sizes at 2–6 hrs (n= 5–9 cells/time-point) (**P < 0.01 by t-test and #P < 0.05 by ANOVA) (E). The mean relative volumes of 43A podosomes were significantly higher than those of 43B invadopodia at 4–6 hrs (**P < 0.01 for both), being at 6 hrs 1.05 ± 0.14 μm3, whereas the volumes of invadopodia were approximately 2.6-fold less (0.40 ± 0.03 μm3). In situ zymography for ECM degradation showed that 43B cells produced significantly more degradation cavities per cell, and the resorption area per cell was also larger compared with 43A cells (**P < 0.01; n= 33 cells for 43A and n= 32 cells for 43B) (F). After 4 hrs, the cavities of 43A cells were predominantly round, whereas substantial diversity in cavity shape and size was detected for 43B cells (G, H). Scale bars: (A), (B), (G), (H): 10 μm; (C), (D): 2 μm.
Fig 8
Fig 8
Dynamics of podosome-like structures and invadopodia. EGFP-actin transfected cells were followed with wide-field time-lapse imaging for 30 min. 43A podosomes were immobile dot-like structures, whereas 43B invadopodia were complex structures with rapid motion of propelling actin tails (A). Arrows indicate single podosomes or actin comet-embedded invadopodia. Inset: A magnified image of the actin tail marked by an arrow. Time-lapse TIRF imaging showed that podosome-like structures, invadopodia and cell extensions were within the narrow TIRF evanescent field and thus in immediate proximity to the substrate (B). In prolonged 12-hr time-lapse, trafficking of EGFP-actin fluorescence to podosomes seemed sparse and no new podosomes were formed. A halo of fluorescent EGFP-actin (arrows) was detected around podosomes. In contrast, rapid motion was detected in 6-hr time-lapse at the basal surface of 43B cells, including actin filaments (arrowheads). Actin comet-based invadopodia were long-lived (arrow). Some propelling movement of the actin tails could also be detected at this level, as well as undulating movement of the club-ended cell extensions. No similar fluorescent EGFP-actin halo as in 43A cells was detected around invadopodia. Scale bar: 20 μm.
Fig 9
Fig 9
Podosome-like structures, invadopodia and invadopodial cell extensions are resistant to inhibitors of actin and tubulin polymerization. The dynamics of EGFP-actin were monitored using wide-field time-lapse microscopy for 30 min. after applying the inhibitors. Treatment with cytochalasin B (10 μM), an inhibitor of actin polymerization, did not change the morphology of podosomes or invadopodia, although cell shape and cytoskeletal actin organization underwent major alterations. The club-ended cell extensions could still be seen in 43B cells after disruption of the actin cytoskeleton (arrows). Scale bar: 20 μm.
Fig 10
Fig 10
FRAP of EGFP-actin, -cortactin and -filamin A in transfected cells. Actin fluorescence intensity in podosome-like structures, invadopodia and cell extensions before photobleaching, immediately after photobleaching, at half-time of recovery (t 1/2), and at plateau of recovery (A). Rectangle, magnified areas show the FRAP analyses of single podosomes and invadopodia; circle, photobleached area. Kinetics of EGFP-actin, -cortactin and -filamin A in podosome-like structures, invadopodia and cell extensions (B). Plateau of recovery in 43A podosomes was reached in 64,45,2s and in 43B invadopodia in 80.6 ± 5.5s (n= 25; P < 0.05). Half-time of recovery of EGFP-actin was 8,00,6s in podosomes, whereas it was significantly longer (10.5 ± 1.0s) in invadopodia (P < 0.05). The mobile fraction of EGFP-actin in invadopodia was less (P < 0.001) compared with the total recovery in podosomes. In 43B cell extensions (n= 9), only 63% recovery was gained, and plateau was reached at 74.4 ± 16.5s with t 1/2 at 11.9 ± 3.2s. Half-time of recovery for EGFP-cortactin was extremely rapid in podosomes (2.4 ± 0.5s), whereas it was 8.4-fold slower (20.1 ± 2.3s) in invadopodia (n= 25; P < 0.0001). Plateau was reached in 22.0 ± 4.7s in 43A and 103.1 ± 6.2s in 43B cells with 100% and 95% mobile fractions. As for EGFP-actin and -cortactin, EGFP-filamin A showed more rapid turnover in podosomes compared with invadopodia (35.2 ± 3.0s versus 44.2 ± 4.1s). The corresponding half-time of recovery was significantly faster in podosomes than in invadopodia (3.8 ± 0.2s versus 5.1 ± 0.5s, n= 25, P < 0.05). The S.E.M. are shown with non-linear regression fit. Scale bars: 10 μm, in small figures: 2 μm.

Similar articles

Cited by

References

    1. Cavallaro U, Christofori G. Cell adhesion and signalling by cadherins and Ig-CAMs in cancer. Nat Rev Cancer. 2004;4:118–32. - PubMed
    1. Weaver AM. Invadopodia: specialized cell structures for cancer invasion. Clin Exp Metastasis. 2006;23:97–105. - PubMed
    1. Linder S. The matrix corroded: podosomes and invadopodia in extracellular matrix degradation. Trends Cell Biol. 2007;17:107–17. - PubMed
    1. Lehto VP, Hovi T, Vartio T, et al. Reorganization of cytoskeletal and contractile elements during transition of human monocytes into adherent macrophages. Lab Invest. 1982;47:391–9. - PubMed
    1. Tarone G, Cirillo D, Giancotti FG, et al. Rous sarcoma virus-transformed fibroblasts adhere primarily at discrete protrusions of the ventral membrane called podosomes. Exp Cell Res. 1985;159:141–57. - PubMed

Publication types

MeSH terms