. 2009 Aug 5:8:186.
doi: 10.1186/1475-2875-8-186.

Defining the relationship between Plasmodium falciparum parasite rate and clinical disease: statistical models for disease burden estimation

Affiliations

Defining the relationship between Plasmodium falciparum parasite rate and clinical disease: statistical models for disease burden estimation

Anand P Patil et al. Malar J. .

Abstract

Background: Clinical malaria has proven an elusive burden to enumerate. Many cases go undetected by routine disease recording systems. Epidemiologists have, therefore, frequently defaulted to actively measuring malaria in population cohorts through time. Measuring the clinical incidence of malaria longitudinally is labour-intensive and impossible to undertake universally. There is a need, therefore, to define a relationship between clinical incidence and the easier and more commonly measured index of infection prevalence: the "parasite rate". This relationship can help provide an informed basis to define malaria burdens in areas where health statistics are inadequate.

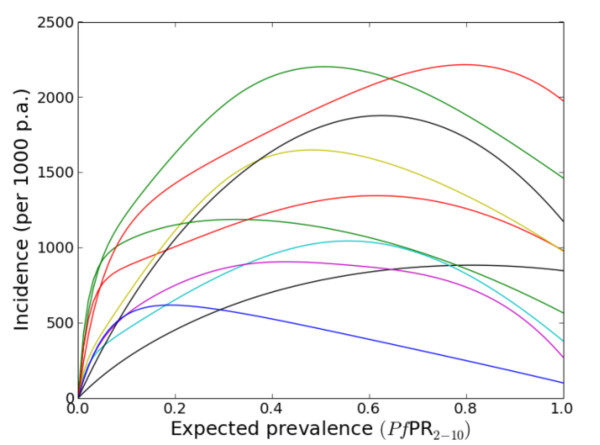
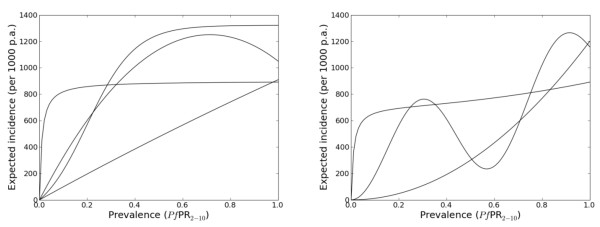
Methods: Formal literature searches were conducted for Plasmodium falciparum malaria incidence surveys undertaken prospectively through active case detection at least every 14 days. The data were abstracted, standardized and geo-referenced. Incidence surveys were time-space matched with modelled estimates of infection prevalence derived from a larger database of parasite prevalence surveys and modelling procedures developed for a global malaria endemicity map. Several potential relationships between clinical incidence and infection prevalence were then specified in a non-parametric Gaussian process model with minimal, biologically informed, prior constraints. Bayesian inference was then used to choose between the candidate models.

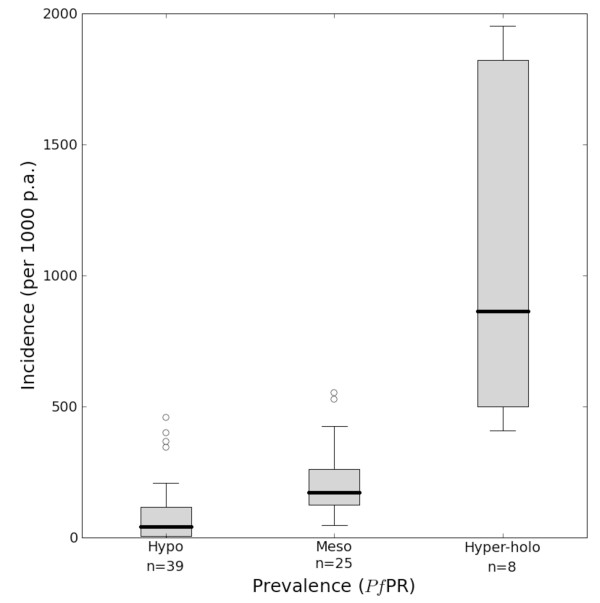
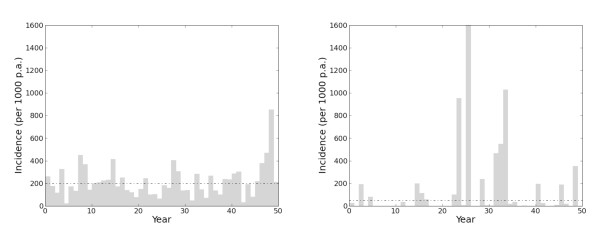
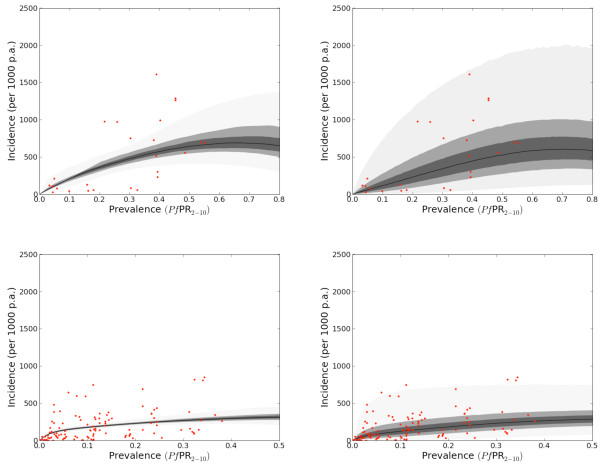
Results: The suggested relationships with credible intervals are shown for the Africa and a combined America and Central and South East Asia regions. In both regions clinical incidence increased slowly and smoothly as a function of infection prevalence. In Africa, when infection prevalence exceeded 40%, clinical incidence reached a plateau of 500 cases per thousand of the population per annum. In the combined America and Central and South East Asia regions, this plateau was reached at 250 cases per thousand of the population per annum. A temporal volatility model was also incorporated to facilitate a closer description of the variance in the observed data.

Conclusion: It was possible to model a relationship between clinical incidence and P. falciparum infection prevalence but the best-fit models were very noisy reflecting the large variance within the observed opportunistic data sample. This continuous quantification allows for estimates of the clinical burden of P. falciparum of known confidence from wherever an estimate of P. falciparum prevalence is available.


Figures

Figure 1
Figure 1
Annual clinical incidence of P. falciparum per 1,000 population in hypoendemic, mesoendemic and combined hyperendemic and holoendemic prevalence conditions [10]. The box indicates the inter-quartile range (25% and 75%) and the thick line within the box represents the median. The whiskers represent the 2.5% and 97.5% centiles and outliers are plotted as circles outside this range. The numbers of observations in each class are shown.
Figure 2
Figure 2
Draws from the prior of the parasite rate verses clinical incidence relationship. These curves provide a small yet representative sample of the possible relationships supported by the model. The colours help differentiate the curves.
Figure 3
Figure 3
Typical time-series of annual incidence specified by the temporal volatility model. The dashed line is the expected incidence (per 1,000 individuals per annum (p.a.)) and the horizontal bars are the observed incidence. The left panel illustrates an "endemic" region of high parasite rate. The incidence in any month is close to the long-term mean, which is relatively high. The right panel shows an "epidemic" region of low parasite rate. The incidence in most months is well below the long-term mean, but occasionally is much greater. The long-term mean in the low parasite rate region is lower than in the high parasite rate region but monthly incidence in the former can occasionally exceed that in the latter.
Figure 4
Figure 4
Possible shapes for the relationship between parasite rate and expected incidence. The relationship between expected incidence per 1000 individuals per annum (p.a.) and prevalence was constrained to be concave down at a parasite rate of 1 and to have at most one inflection point. The curves in the left-hand panel are examples of allowable relationships by these criteria, and the curves in the right-hand panel are examples of relationships that are not allowed.
Figure 5
Figure 5
Relationship between parasite rate and incidence. Left: the posterior distribution of expected population-wide incidence (per 1000 individuals per annum (p.a.)) against prevalence. This relationship would describe the observed incidence if surveillance were conducted for a very long time. Right: the predictive distribution of actual population-wide incidence per 1000 individuals in any given year. The right-hand panels take temporal volatility into account, therefore, whereas the left-hand panels average it out. The top row shows the Africa+ region (n = 25) and the bottom the CSE Asia and the Americas regions combined (n = 116). The data points are the red dots, the black line is the median and the 0.25, 0.5 and 0.95 credible intervals centred on the median are shown in shades of progressively lighter grey.
Figure 6
Figure 6
Spatial semivariograms of model residuals. Sample semivariograms of deviance residuals estimated at discrete lags (circles) and compared to a Monte Carlo null envelope (dashed lines) representing the range of values expected by chance in the absence of spatial autocorrelation. An estimated value falling outside the null envelope is indicative of significant spatial structure in the residuals at that lag. Shown are plots for the Africa+ region (left) and the combined Central and South East Asia and Americas regions (right).
Figure 7
Figure 7
Annual clinical incidence of P. falciparum per 1,000 population in hypoendemic, mesoendemic and combined hyperendemic and holoendemic prevalence conditions. The box indicates the inter-quartile range (25% and 75%) and the thick line within the box represents the median. The whiskers represent the 2.5% and 97.5% centiles and outliers are plotted as circles outside this range. The number of observations in each class is shown.

References

    1. Bruce-Chwatt LJ. Malaria in African infants and children in Southern Nigeria. Ann Trop Med Parasitol. 1952;46:173–200. - PubMed
    1. Carter R, Mendis KN. Evolutionary and historical aspects of the burden of malaria. Clin Microbiol Rev. 2002;15:564–594. doi: 10.1128/CMR.15.4.564-594.2002. - DOI - PMC - PubMed
    1. Greenwood BM. Population at risk. Parasitol Today. 1990;6:188. doi: 10.1016/0169-4758(90)90351-4. - DOI - PubMed
    1. Hay SI, Guerra CA, Tatem AJ, Atkinson PM, Snow RW. Urbanization, malaria transmission and disease burden in Africa. Nat Rev Microbiol. 2005;3:81–90. doi: 10.1038/nrmicro1069. - DOI - PMC - PubMed
    1. Roca-Feltrer A, Carneiro I, Armstrong Schellenberg JR. Estimates of the burden of malaria morbidity in Africa in children under the age of 5 years. Trop Med Int Health. 2008;13:771–783. - PubMed

Publication types

LinkOut - more resources