. 2009 Aug 5:10:361.
doi: 10.1186/1471-2164-10-361.

Genomic analysis of a sexually-selected character: EST sequencing and microarray analysis of eye-antennal imaginal discs in the stalk-eyed fly Teleopsis dalmanni (Diopsidae)

Affiliations

Genomic analysis of a sexually-selected character: EST sequencing and microarray analysis of eye-antennal imaginal discs in the stalk-eyed fly Teleopsis dalmanni (Diopsidae)

Richard H Baker et al. BMC Genomics. .

Abstract

Background: Many species of stalk-eyed flies (Diopsidae) possess highly-exaggerated, sexually dimorphic eye-stalks that play an important role in the mating system of these flies. Eye-stalks are increasingly being used as a model system for studying sexual selection, but little is known about the genetic mechanisms producing variation in these ornamental traits. Therefore, we constructed an EST database of genes expressed in the developing eye-antennal imaginal disc of the highly dimorphic species Teleopsis dalmanni. We used this set of genes to construct microarray slides and compare patterns of gene expression between lines of flies with divergent eyespan.

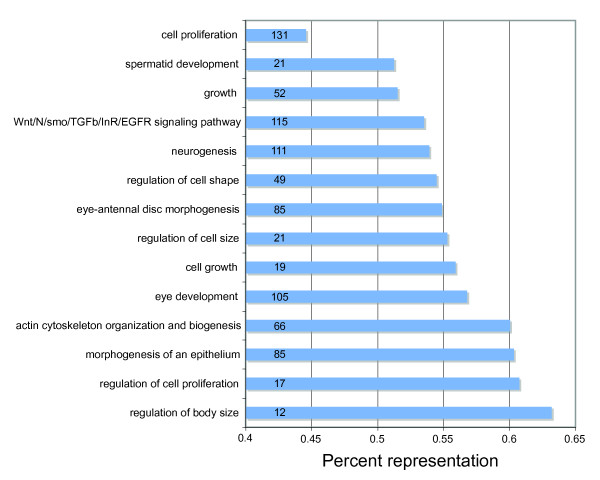
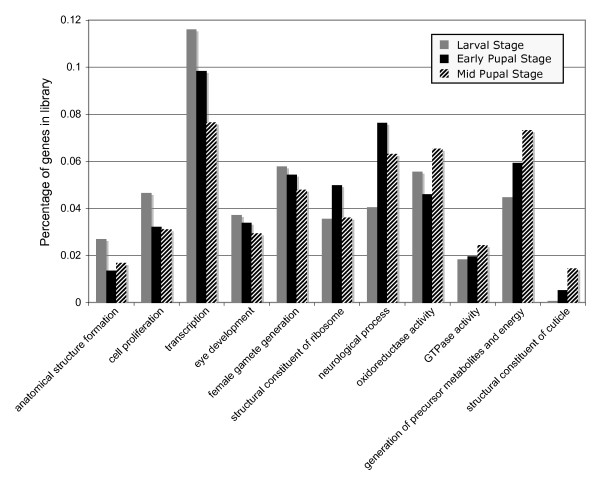
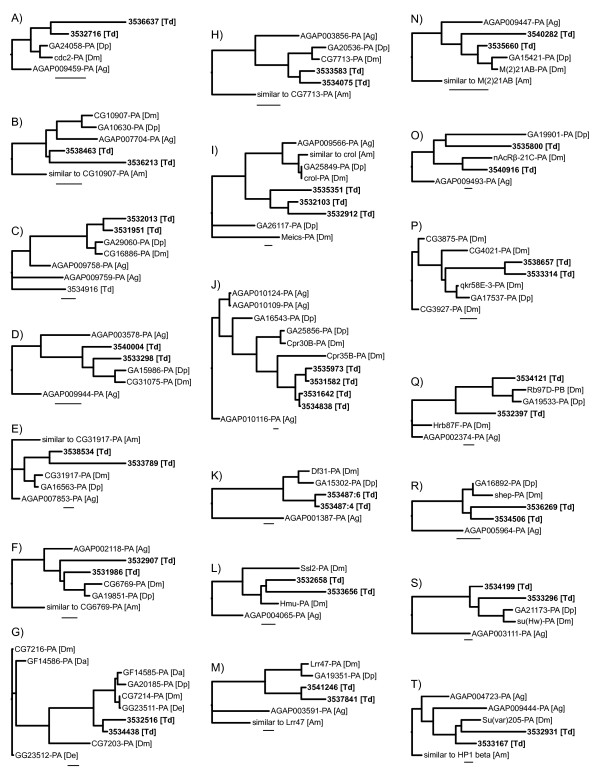
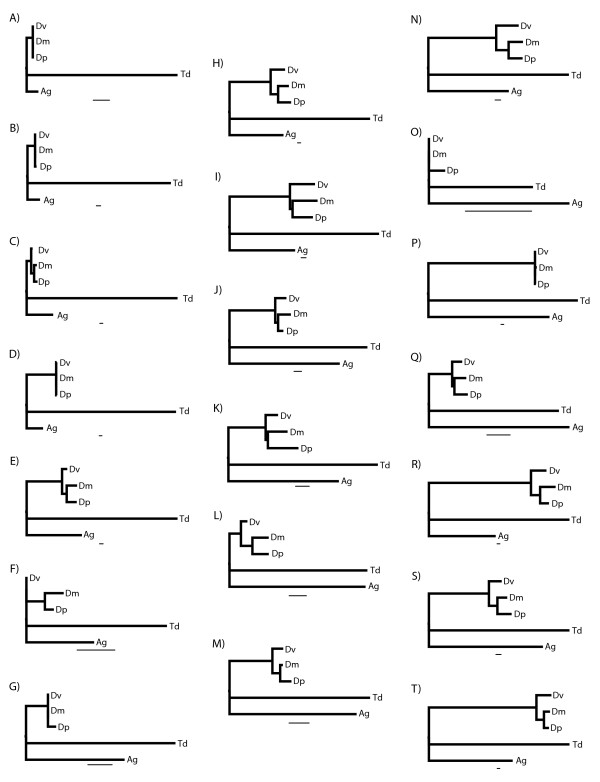
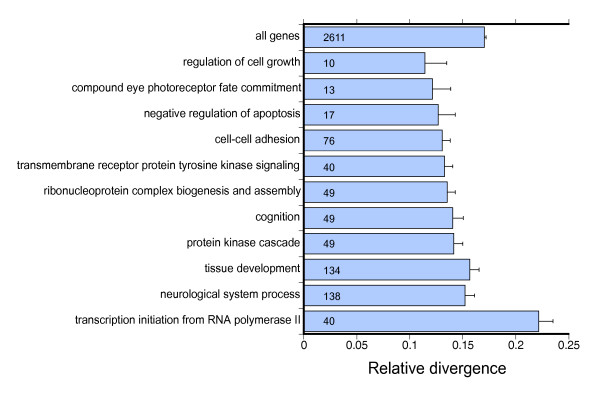
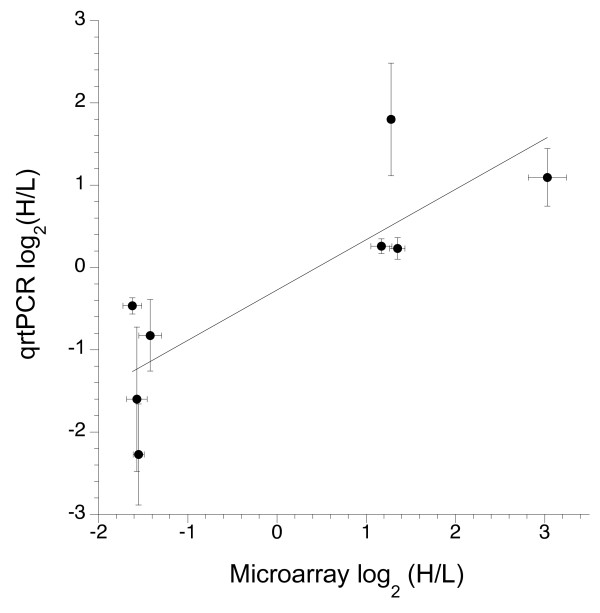
Results: We generated 33,229 high-quality ESTs from three non-normalized libraries made from the developing eye-stalk tissue at different developmental stages. EST assembly and annotation produced a total of 7,066 clusters comprising 3,424 unique genes with significant sequence similarity to a protein in either Drosophila melanogaster or Anopheles gambiae. Comparisons of the transcript profiles at different stages reveal a developmental shift in relative expression from genes involved in anatomical structure formation, transcription, and cell proliferation at the larval stage to genes involved in neurological processes and cuticle production during the pupal stages. Based on alignments of the EST fragments to homologous sequences in Drosophila and Anopheles, we identified 20 putative gene duplication events in T. dalmanni and numerous genes undergoing significantly faster rates of evolution in T. dalmanni relative to the other Dipteran species. Microarray experiments identified over 350 genes with significant differential expression between flies from lines selected for high and low relative eyespan but did not reveal any primary biological process or pathway that is driving the expression differences.

Conclusion: The catalogue of genes identified in the EST database provides a valuable framework for a comprehensive examination of the genetic basis of eye-stalk variation. Several candidate genes, such as crooked legs, cdc2, CG31917 and CG11577, emerge from the analysis of gene duplication, protein evolution and microarray gene expression. Additional comparisons of expression profiles between, for example, males and females, and species that differ in eye-stalk sexual dimorphism, are now enabled by these resources.


Figures

Figure 1
Figure 1
Percentage of Drosophila genes identified in T. dalmanni EST database. For Biological Process (BP) categories that are likely to be important in eye-stalk development and evolution, the bars represent the percentage of D. melanogaster genes belonging to that category for which homologues have been identified in the EST database. The numbers within each bar indicate how many genes were found within that category in the T. dalmanni libraries.
Figure 2
Figure 2
Gene expression differences among developmental stages. The percentage of genes in each developmental stage library is presented for GO categories that exhibit significant over-representation in one of the three libraries relative to the EST database as a whole.
Figure 3
Figure 3
Putative gene duplication events in the T. dalmanni lineage. A) cdc2, B) CG10907, C) CG16886, D) CG31075, E) CG31917, F) CG6769, G) CG7214, H) CG7713, I) crooked legs, J) Cuticular protein 35B, K) Decondensation factor 31, L) Hemomucin, M) Leucine-rich repeat 47, N) Minute (2) 21AB, O) nicotinic acetylcholine receptor beta 21C, P) quaking related 58E-3, Q) Ribonuclear protein at 97D, R) alan shepard, S) suppressor of Hairy wing, T) Suppressor of variegation 205. Consensus sequences (conseqs) from different clusters were categorized as paralogous copies of the same gene if the amino acid divergence between the T. dalmanni conseqs was greater than 10% and if all conseqs and the top hit gene from Drosophila melanogaster are monophyletic relative to the Anopheles and Apis proteins and other D. melanogaster genes. The species included in the phylogenetic analysis are Anopheles gambiae (Ag), Apis mellifera (Am), Drosophila ananassae (Da), Drosophila erecta (De), Drosophila melanogaster (Dm), Drosophila pseudoobscura (Dp), and Teleopsis dalmanni (Td). The seven-digit number associated with the T. dalmanni clades is the cluster reference number. The scale bar is equivalent to 0.1.
Figure 4
Figure 4
The twenty fastest evolving genes in T. dalmanni. A) beta-Tubulin at 85D, B) CG17293, C) rhea, D) crooked legs, E) CG9520, F) ran, G) lesswright, H) CG4598, I) CG6480, J) TBPH, K) Small ribonucleoprotein particle protein B, L) CG31352, M) alien, N) expanded, O) Sec61alpha, P) CG31670, Q) CG5585, R) CNG channel-like, S) p115, T) CG7372. Genes were ranked based on the percentage of the total tree length comprised by the branch leading to T. dalmanni (Td). The other Dipteran taxa include A. gambiae (Ag) and three Drosophila species–D. melanogaster (Dm), D. pseudoobscura (Dp) and D. virilis (Dv). Only genes that had at least 150 amino acids of aligned sequence data are shown. All genes exhibited significantly increased rates of change compared to each of the three Drosophila species based on a relative rate test. The scale bar is equivalent to 0.02.
Figure 5
Figure 5
Biological process categories undergoing significantly slower or faster rates of evolutionary change. X-axis represents the percentage of the total tree length comprised by the branch leading to T. dalmanni. The sample sizes for the various process categories are depicted in the bars. The 'all genes' bar provides the average rate of divergence for all analyzed genes.
Figure 6
Figure 6
Relative gene expression estimated by oligoarrays correlates with relative expression estimated by qrtPCR. Calculation of fold change for eight target genes was estimated relative to the expression level of a control gene, GAPDH, using the 2-ΔΔCT method. Error bars indicate one standard error and are based on four biological replicates for each selected line for qrtPCR and eight biological replicates for microarrays.

Similar articles

Cited by

References

    1. Pomiankowski A, Møller AP. A resolution of the Lek paradox. Proc R Soc Lond B. 1995;260:21–29. doi: 10.1098/rspb.1995.0054. - DOI
    1. Eads B, Colbourne J, Bohuski E, Andrews J. Profiling sex-biased gene expression during parthenogenetic reproduction in Daphnia pulex. BMC Genomics. 2007;8:464. doi: 10.1186/1471-2164-8-464. - DOI - PMC - PubMed
    1. Ellegren H, Parsch J. The evolution of sex-biased genes and sex-biased gene expression. Nat Rev Genet. 2007;8:689–698. doi: 10.1038/nrg2167. - DOI - PubMed
    1. Jin W, Riley R, Wolfinger R, White K, Passador-Gurgel G, Gibson G. The contributions of sex, genotype and age to transcriptional variance in Drosophila melanogaster. Nature Genetics. 2001;29:389–395. doi: 10.1038/ng766. - DOI - PubMed
    1. Meiklejohn CD, Parsch J, Ranz JM, Hartl DL. Rapid evolution of male-biased gene expression in Drosophila. Proc Natl Acad Sci USA. 2003;100:9894–9899. doi: 10.1073/pnas.1630690100. - DOI - PMC - PubMed

Publication types

MeSH terms