. 2009 Aug;10(2):89-98.
doi: 10.1016/j.cmet.2009.06.011.

Leptin acts via leptin receptor-expressing lateral hypothalamic neurons to modulate the mesolimbic dopamine system and suppress feeding

Affiliations

Leptin acts via leptin receptor-expressing lateral hypothalamic neurons to modulate the mesolimbic dopamine system and suppress feeding

Gina M Leinninger et al. Cell Metab. 2009 Aug.

Abstract

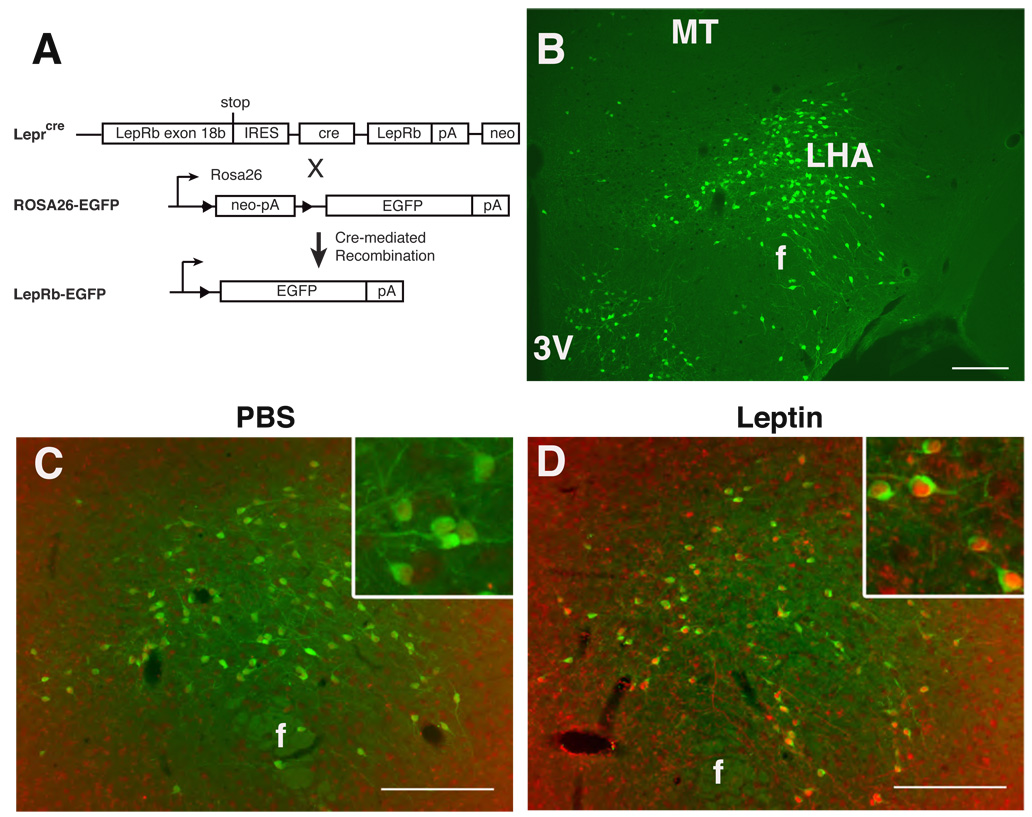
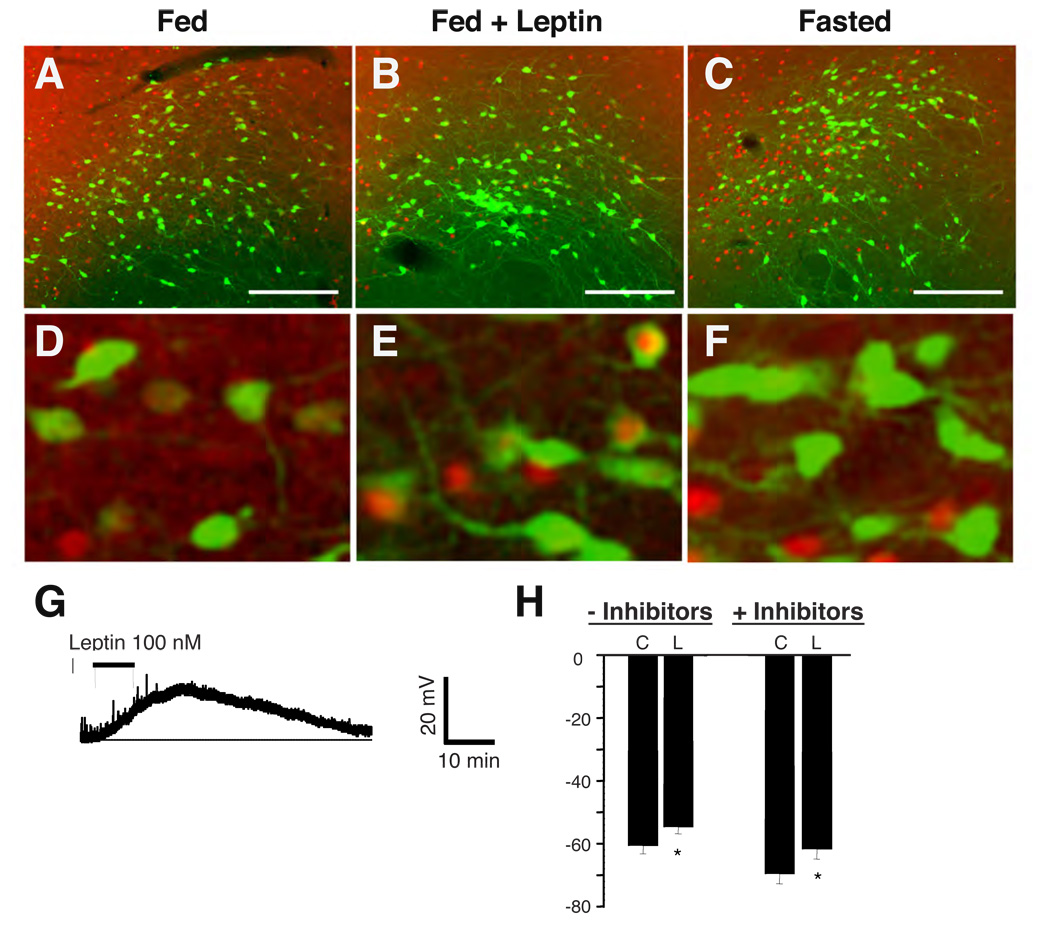
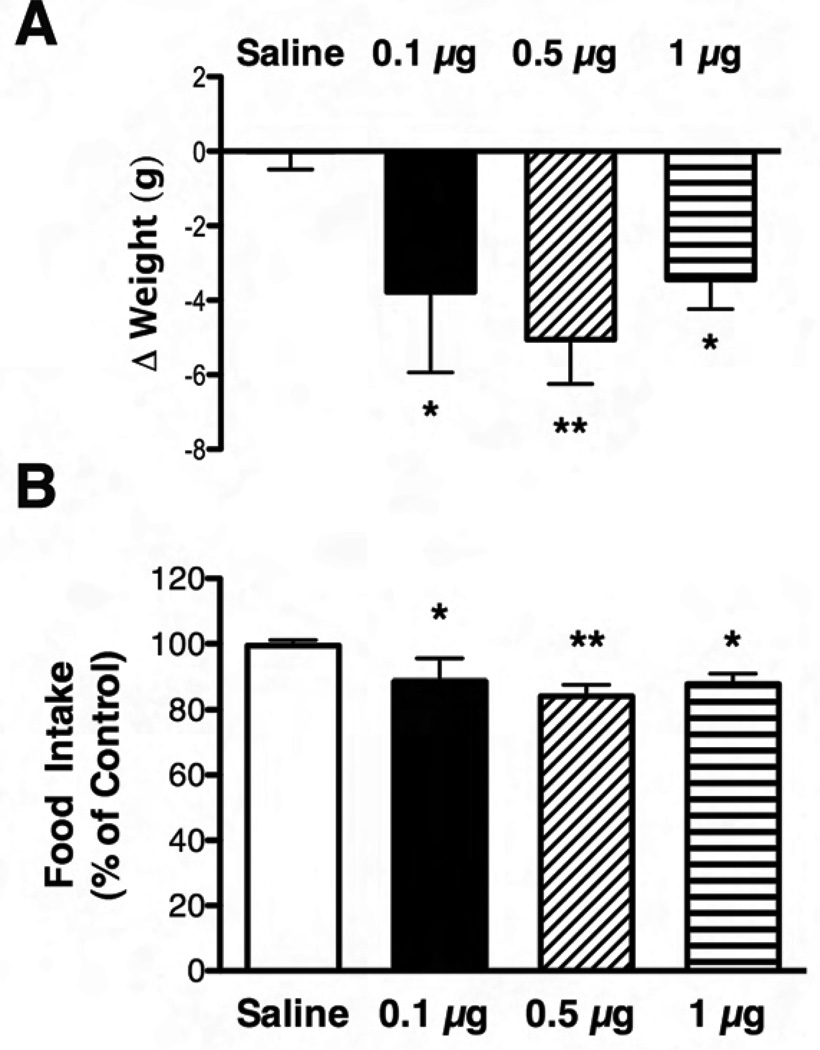
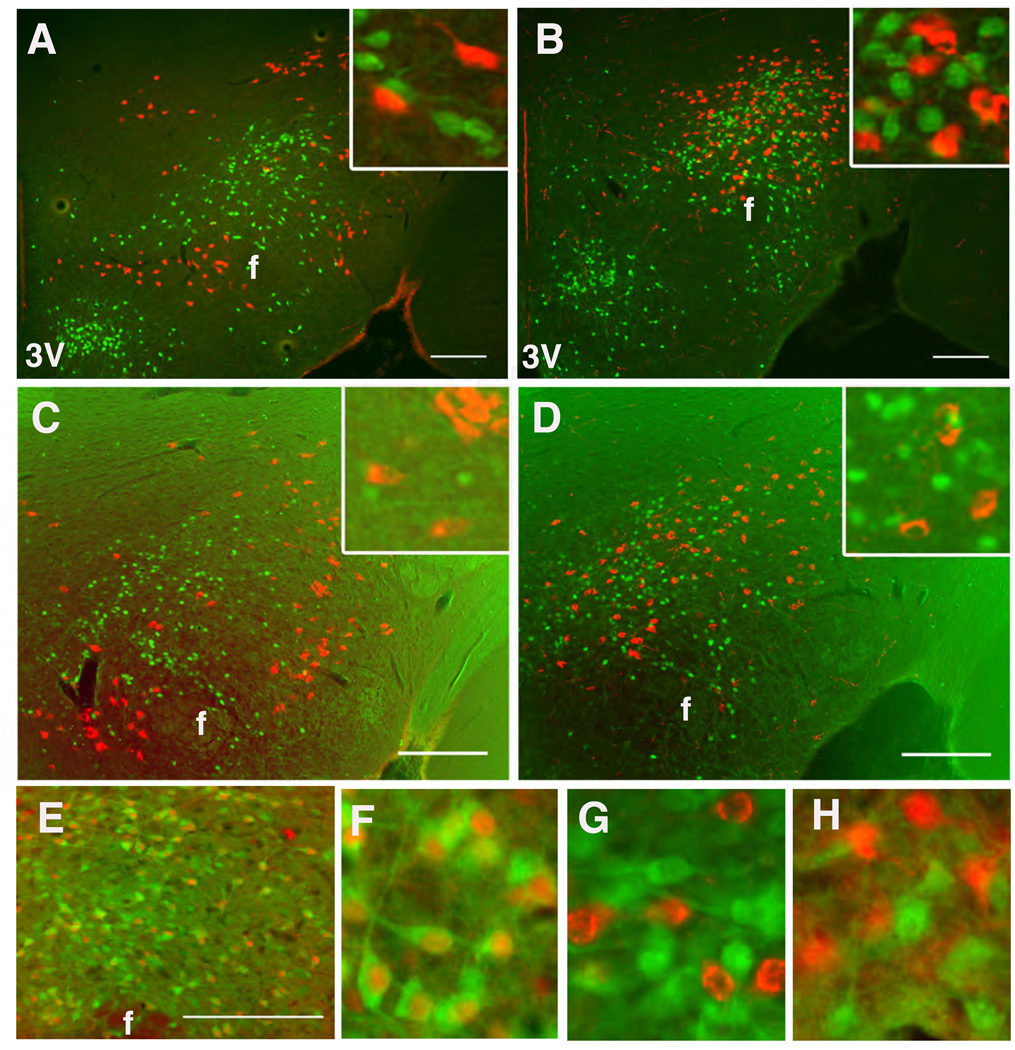
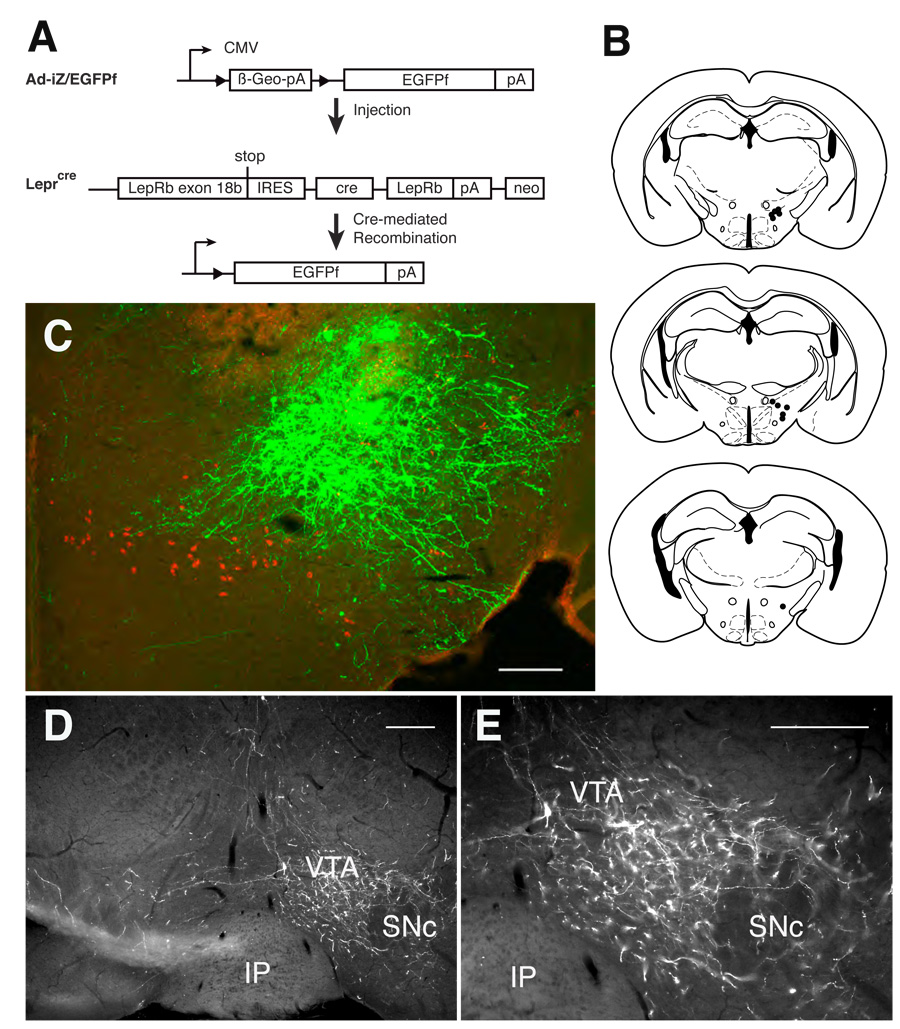
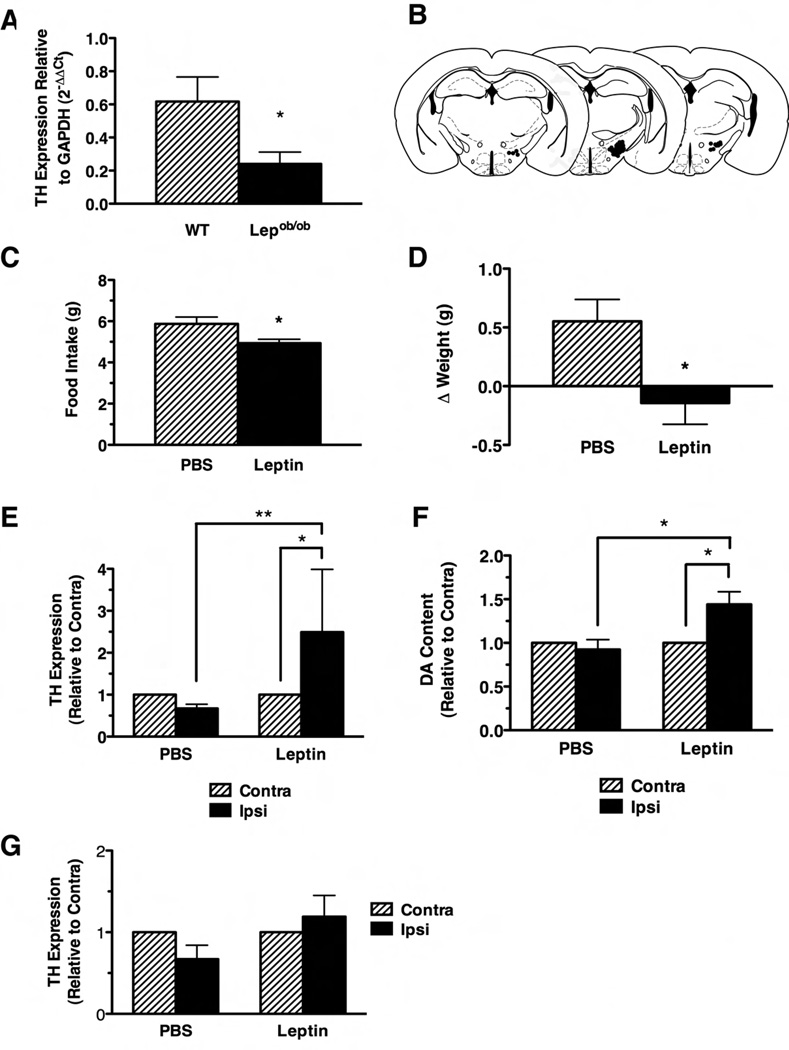
The lateral hypothalamic area (LHA) acts in concert with the ventral tegmental area (VTA) and other components of the mesolimbic dopamine (DA) system to control motivation, including the incentive to feed. The anorexigenic hormone leptin modulates the mesolimbic DA system, although the mechanisms underlying this control have remained incompletely understood. We show that leptin directly regulates a population of leptin receptor (LepRb)-expressing inhibitory neurons in the LHA and that leptin action via these LHA LepRb neurons decreases feeding and body weight. Furthermore, these LHA LepRb neurons innervate the VTA, and leptin action on these neurons restores VTA expression of the rate-limiting enzyme in DA production along with mesolimbic DA content in leptin-deficient animals. Thus, these findings reveal that LHA LepRb neurons link anorexic leptin action to the mesolimbic DA system.


Figures

Figure 1
Figure 1. LepRbEGFP mice reveal a large population of leptin-responsive LHA LepRb neurons
(A) Schematic diagram demonstrating cre-mediated EGFP expression in LepRb expressing cells of LepRbEGFP mice. (B) Immunofluorescent detection of EGFP (green) in the LHA of LepRbEGFP mice. (C,D) Immunohistochemical detection of pSTAT3-IR (red nuclei) and EGFP (green) in the LHA of LepRbEGFP mice following IP treatment with vehicle (C) or leptin (5 mg/kg, 2 hours) (D). Insets: higher magnification view of labeled LHA neurons. Scale bars = 10 µm. 3V= third cerebral ventricle; MT= mammilothalamic tract; f= fornix.
Figure 2
Figure 2. Leptin directly regulates the activity of LHA LepRb neurons in LepRbEGFP mice
(A–F) Immunohistochemical detection of FosIR (red nuclei, pseudocolored) and immunofluorescent detection of GFP (green) in LepRbEGFP animals following ad libitum feeding (A,D) or fasting for 36 hours (C,F) followed by treatment with vehicle, or ad libitum-fed animals following leptin treatment (B,E) (5 mg/kg, IP 4 hours). Scale bars = 10 µm. Panels D–F show higher magnification images of a-c, respectively. (G,H) Electrophysiologic response of LHA LepRb neurons to leptin. EGFP-expressing LHA neurons were identified under light and fluorescent microscopy for recording under current clamp conditions and examined for their electrophysiologic response to leptin. One population of neurons were depolarized in response to leptin (G). (H) Graphs of the response of neurons that were depolarized in response to leptin in the absence (-Inhibitors) or presence (+Inhibitors) of inhibitors of synaptic transmission. Error bars represent the SEM.
Figure 3
Figure 3. Response of rats to intra-LHA leptin treatment
Change in weight (A) and total food intake (B) in Long Evans rats in response to 24h treatment with intra-LHA saline (white bars) or 0.1 µg (black bars), 0.5 µg (diagonally hatched bars) or 1 µg leptin (horizontally hatched bars). Food intake over 24 hours is plotted as percent of intake following saline injection; weight data are plotted as change in weight over 24 hours. Average values +/−SEM are shown; *p<0.05, **p<0.01 compared to saline by one way ANOVA with Dunnett post test.
Figure 4
Figure 4. Neurotransmitter content of LHA LepRb Neurons
(A,B) Immunofluorescent detection of EGFP (green) and MCH (A, red) or OX (B, red) in the LHA of colchicine-treated LepRbEGFP mice. (C,D) Immunohistochemical detection of pSTAT3-IR (green nuclei, pseudocolored) and MCH (C, red) or OX (D, red) following ICV leptin treatment for 1 hr. (E) Immunohistochemical detection of pSTAT3 (red, pseudocolored) and immunofluorescent detection of EGFP (green) in Gad1EGFP mice. (F) Digital zoom of (E). (G,H) immunofluorescent detection of EGFP (green) and OX (red (G)) or MCH (red (H))in mice that express EGFP in GAD67 neurons. Scale bars = 10 µm. 3V= third cerebral ventricle; f= fornix
Figure 5
Figure 5. Ad-iZ/EGFPf-mediated tracing reveals projection of LHA LepRb neurons to the VTA
(A) Schematic diagram showing cre-mediated expression of EGFPf in infected LepRb-expressing neurons following stereotaxic injection of Ad-iZ/EGFPf into Leprcremice. (B) Summary of Ad-iZ/EGFPf injection sites for the eleven (11) cases utilized for the study. (C) Immunofluorescent detection of EGFPf (green) and MCH (red) in the LHA of an example of a correctly targeted intra-LHA injection of Ad-iZ/EGFPf in the Leprcremice. (D) Immunofluorescent detection of EGFPf-containing projections in the VTA of Leprcre mice following intra-LHA injection of Ad-iZ/EGFPf. (E) Higher magnification of (D). Scale bars = 10 µm. VTA= ventral tegmental area; SNc- substantia nigra pars compacta; IP= interpeduncular tubercle.
Figure 6
Figure 6. Energy balance, VTA TH mRNA Expression, and NAc DA content in Lepob/ob mice after intra-LHA leptin treatment
(A) TH mRNA levels in the VTA of normal C57/Bl6 mice (WT, hatched bar) and Lepob/ob mice (solid bar). TH expression for each genotype is shown relative to GAPDH expression (calculated by the 2−ΔΔCt method) +/−SEM; *p<0.05. (B) Summary of LHA cannulation sites in the Lepob/ob mice included in the study. 24-hour food intake (C) and body weight change (D) in Lepob/ob mice in response to intra-LHA PBS (hatched bars) or leptin (solid bars). All data are plotted as average +/− SEM; *p<0.05. VTA TH mRNA expression relative to GAPDH (E) and NAc DA content (F) contralateral (hatched bars) and ipsilateral (solid bars) in Lepob/ob mice mice treated with 24 hours of intra-LHA PBS or leptin. Values are shown relative to the (unperturbed) contralateral side,+/− SEM; *p<0.05, **p<0.01. (G) Expression of TH mRNA relative to GAPDH in Lepob/ob mice mice treated with 24 hours of intra-VTA PBS or leptin. Data are plotted as in E. Significance determined by one way ANOVA with Bonferroni post-tests.

Comment in

References

    1. Abe H, Yanagawa Y, Kanbara K, Maemura K, Hayasaki H, Azuma H, Obata K, Katsuoka Y, Yabumoto M, Watanabe M. Epithelial localization of green fluorescent protein-positive cells in epididymis of the GAD67-GFP knock-in mouse. J Androl. 2005;26:568–577. - PubMed
    1. Balthasar N, Coppari R, McMinn J, Liu SM, Lee CE, Tang V, Kenny CD, McGovern RA, Chua SC, Jr, Elmquist JK, Lowell BB. Leptin Receptor Signaling in POMC Neurons Is Required for Normal Body Weight Homeostasis. Neuron. 2004;42:983–991. - PubMed
    1. Berthoud HR. Interactions between the “cognitive” and “metabolic” brain in the control of food intake. Physiol Behav. 2007 - PubMed
    1. Cohen P, Zhao C, Cai X, Montez JM, Rohani SC, Feinstein P, Mombaerts P, Friedman JM. Selective deletion of leptin receptor in neurons leads to obesity. J Clin Invest. 2001;108:1113–1121. - PMC - PubMed
    1. de Luca C, Kowalski TJ, Zhang Y, Elmquist JK, Lee C, Kilimann MW, Ludwig T, Liu SM, Chua SC., Jr Complete rescue of obesity, diabetes, and infertility in db/db mice by neuron-specific LEPR-B transgenes. J Clin. Invest. 2005;115:3484–3493. - PMC - PubMed

Publication types