. 2009 Oct 2;8(10):1215-24.
doi: 10.1016/j.dnarep.2009.07.003. Epub 2009 Aug 4.

Ribosomal protein S3: A multi-functional protein that interacts with both p53 and MDM2 through its KH domain

Affiliations

Ribosomal protein S3: A multi-functional protein that interacts with both p53 and MDM2 through its KH domain

Sridevi Yadavilli et al. DNA Repair (Amst). .

Abstract

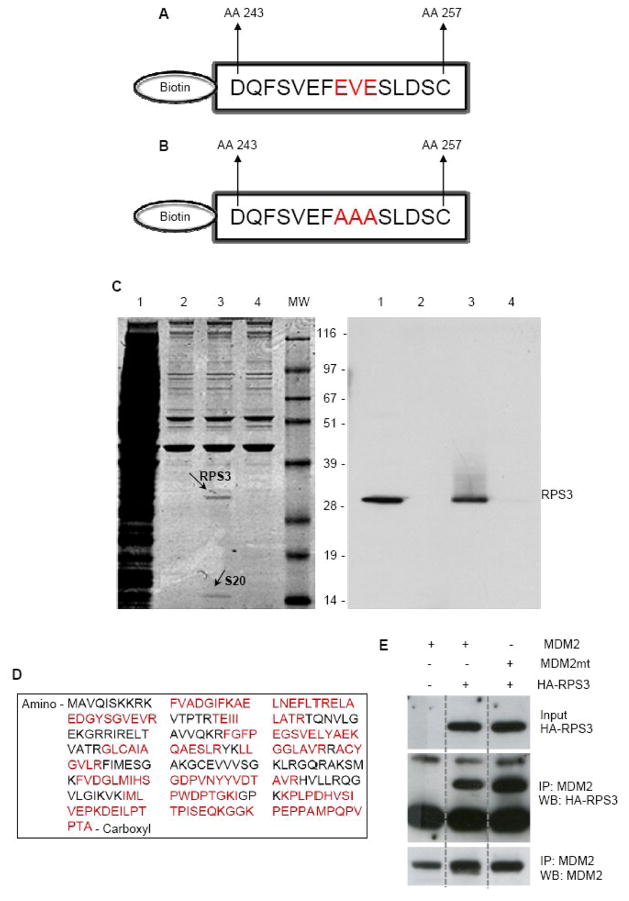
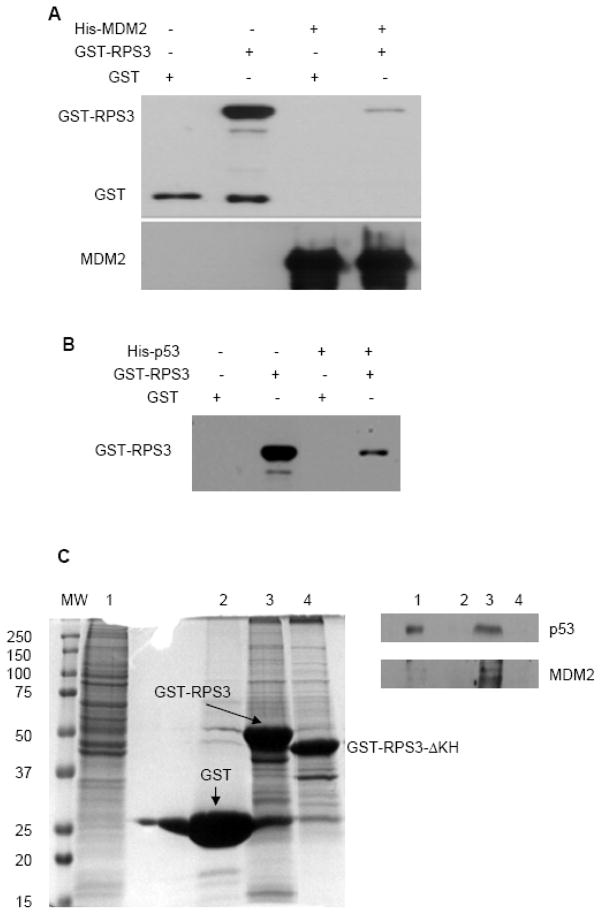
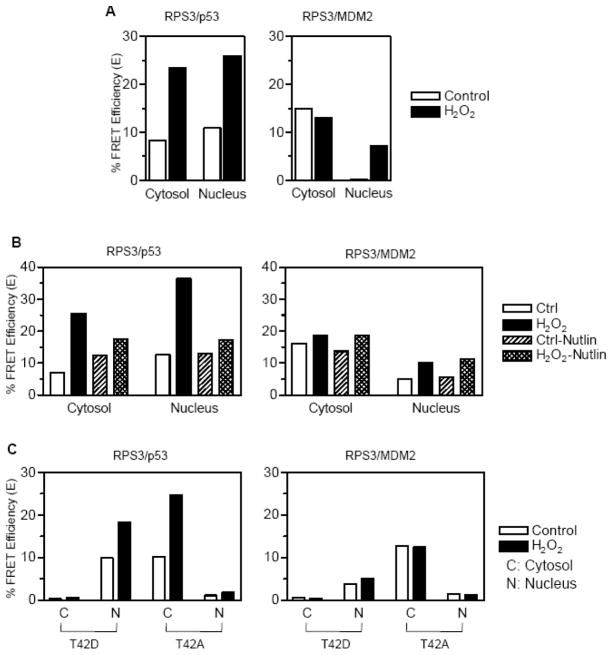
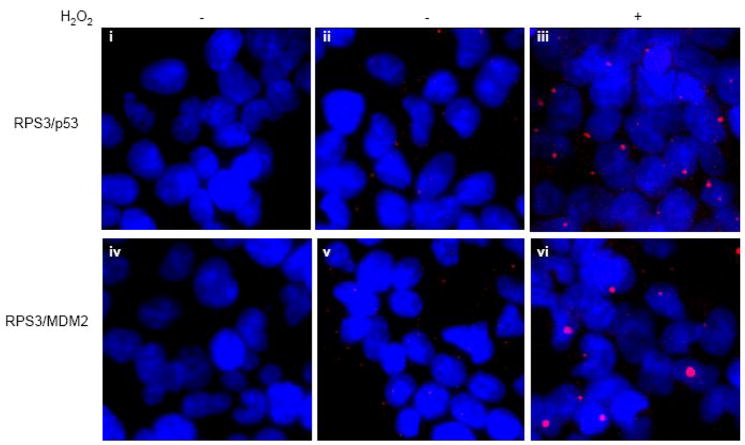
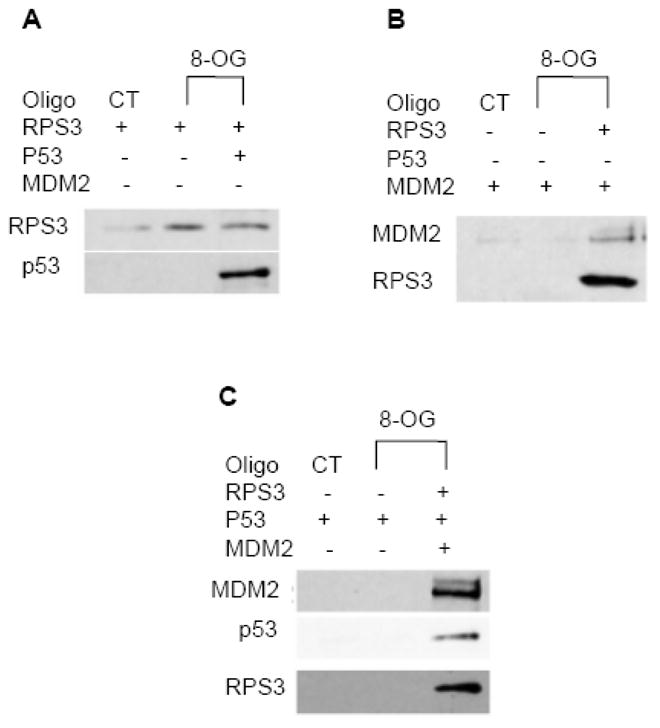
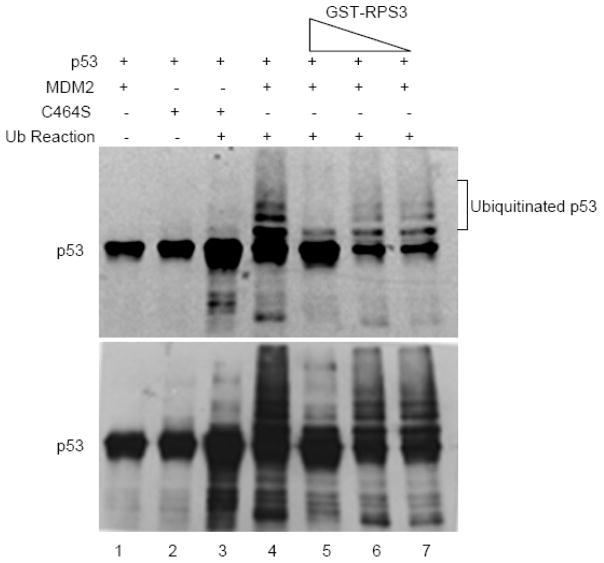
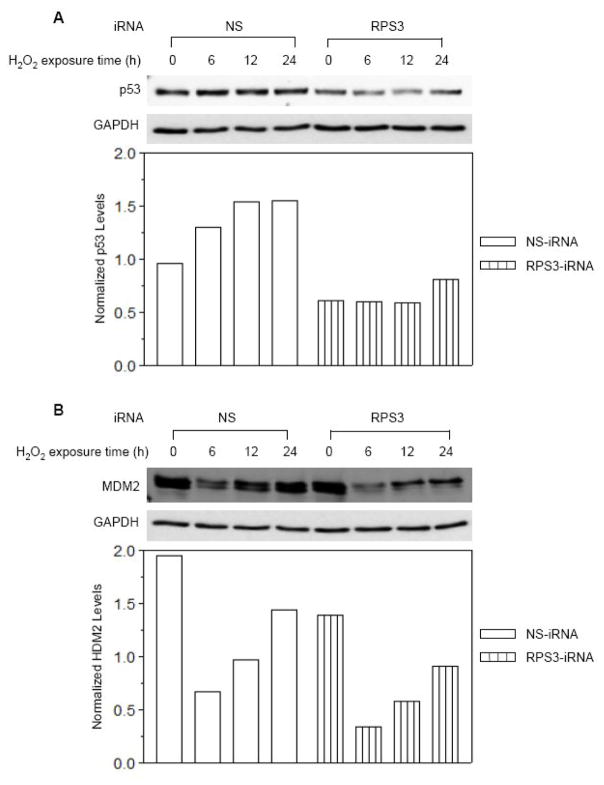
The p53 protein responds to cellular stress and regulates genes involved in cell cycle, apoptosis, and DNA repair. Under normal conditions, p53 levels are kept low through MDM2-mediated ubiquitination and proteosomal degradation. In search for novel proteins that participate in this regulatory loop, we performed an MDM2 peptide pull-down assay and mass spectrometry to screen for potential interacting partners of MDM2. We identified ribosomal protein S3 (RPS3), whose interaction with MDM2, and notably p53, was further established by His and GST pull-down assays, fluorescence resonance energy transfer and an in situ proximity ligation assay. Additionally, in cells exposed to oxidative stress, p53 levels increased slightly over 24h, whereas MDM2 levels declined after 6h exposure, but rose over the next 18h of exposure. Conversely, in cells exposed to oxidative stress and harboring siRNA to knockdown RPS3 expression, decreased p53 levels and loss of the E3 ubiquitin ligase domain possessed by MDM2 were observed. DNA pull-down assays using a 7,8-dihydro-8-oxoguanine duplex oligonucleotide as a substrate found that RPS3 acted as a scaffold for the additional binding of MDM2 and p53, suggesting that RPS3 interacts with important proteins involved in maintaining genomic integrity.


Conflict of interest statement

Conflict of interest

The authors declare that there are no conflicts of interest.

Figures

Fig. 1
Fig. 1
RPS3 interacts with MDM2 as determined by biotin tagged peptide pull -down assay using MDM2 peptides. (A) Biotin-labeled MDM2-acidic domain peptide comprising the amino acid segment 243–257, which lies within the central acidic domain of MDM2 (AA 230 – AA 300). (B) MDM2 acidic domain mutant peptide with three amino acids (EVE) within the wild type peptide mutated to alanine. (C) Whole cell lysates prepared from H1299 cells were incubated with Biotin-labeled MDM2-acidic domain peptide or MDM2 acidic domain mutant peptide that were immobilized onto streptavidin-agarose beads. After washing the beads, protein complexes were purified, separated on SDS-PAGE and Coomassie stained (left panel) Lane 1 is the total cell extract, lane 2 is the beads only control, lane 3 is the wild type MDM2 peptide and lane 4 is the acidic domain mutant MDM2 peptide. Protein bands appearing only in lane 3 were excised and subjected to tryptic digestion and mass spectrometry analysis. RPS3 and RPS20 were identified in this way. In the right panel, proteins were electro-transferred and analyzed by immunoblotting the membrane with an antibody specific to RPS3. The same result was obtained when using U2OS cells (not shown) (D) Amino acid sequence of the human RPS3, showing the tryptic peptides (red) used for protein identification. (E) U2OS cells were transfected with plasmids expressing human MDM2, an MDM2 mutant with the same mutation in the acidic domain as the peptide in (B), and/or an expression vector for HA-tagged RPS3. Cell extracts were immunoprecipitated with 2A10 mouse monoclonal antibody against MDM2. Proteins were detected by Western blot using an anti-HA antibody or the mouse monoclonal antibody 4B2 against MDM2.
Fig. 2
Fig. 2
Interaction of MDM2 and p53 with RPS3 by protein pull-down assays. (A) Purified His-MDM2 immobilized on to NiNTA beads were mixed with GST or GST-RPS3 contained in binding buffer and incubated for 1 h at room temperature. Beads were then collected, washed and protein complexes eluted into Laemmli buffer. After resolving the protein complexes on SDS-PAGE, the interaction of RPS3 with MDM2 was analyzed by immunoblotting by probing the membrane with GST and MDM2 antibodies. (B) Reaction mixtures containing His-p53 bound to NiNTA beads and purified GST or GST-RPS3 proteins were processed as in (A) and the interaction of RPS3 with p53 was demonstrated by using an antibody to GST. (C) GST pull-down was performed by incubating HEK 293 whole cell lysate with GST (lane 2), GST-RPS3 (lane 3) or GST-RPS3-ΔKH (lane 4) immobilized onto agarose beads. After elution and SDS-PAGE, proteins were observed by Coomassie staining (left panel) and identified by immunoblotting with p53 and MDM2 antibodies (right panel). The whole cell lysate used for the pull-down (lane 1) is shown as a control for total protein.
Fig. 3
Fig. 3
FRET analysis to determine the interactions between RPS3/p53 and RPS3/MDM2. (A) HEK 293 cells co-transfected for 24 h with pECFP-N1-p53 and pEYFP-N1-RPS3 (left panel), pECFP-N1-MDM2 and pEYFP-N1-RPS3 (right panel) were left untreated or treated with 0.25 mM H2O2. At 24 h of treatment with H2O2, samples were fixed, washed and mounted onto slides and analyzed for FRET by confocal microscopy using acceptor photobleaching method. Cells showing equal prebleach intensities of YFP were photobleached with 514 nm laser using time bleach protocol and a total of 10 images recorded to calculate the FRET efficiency. After plotting the fluorescence intensities of 5 pre-bleach and 5 post-bleach images over time, the efficiency of FRET (E) was calculated using E=1−(IDA/ID) where IDA and ID represent steady state CFP fluorescence in the presence and absence of the YFP, respectively. (B) FRET analysis was performed on HEK 293 cells which were transfected similar to that described for corresponding left and right panels of (A) but pre-treated with 10 μM Nutlin-3 or the carrier DMSO before being treated with 0.25 mM H2O2 for 24 h. (C) HEK 293 cells were co-transfected for 24 h with phosphorylation mimic T42D or phosphorylation deficient T42A mutants of RPS3 cloned into pEYFP-N1 and pECFP-N1-p53 (left panel) or, pECFP-N1-MDM2 (right panel). After treatment with H2O2 for 24 h, FRET analysis was performed as described for (a).
Fig. 4
Fig. 4
In Situ proximity ligation assay (PLA) confirms the interactions of RPS3 with p53 and MDM2. Olink in situ PLA was performed on HEK 293 cells grown on chamber slides. Untreated or H2O2 (0.25mM) treated cells for 24 h were fixed and processed for in situ PLA by incubating with specific antibody mixtures of p53/RPS3 (panels ii and iii) and MDM2/RPS3 (panels v and vi). After the subsequent incubation steps with PLA probes, hybridization, ligation, polymerization and detection mixtures, samples were mounted with DAPI containing mounting medium and subjected to epifluorescence microscopy using texas red (red) and DAPI (blue) filters. For each sample, a representative image, which is a merge of the red and blue channels, is shown. In panels i (p53 antibody only) and iv (MDM2 antibody only), RPS3 antibody was omitted and used as negative controls to demonstrate the specificity of the protein:protein interactions.
Fig. 5
Fig. 5
RPS3/p53 and RPS3/MDM2 interactions can localize at 8-oxodG sites as determined by in vitro 8-oxodG duplex 37mer pull-down assay. (A) 5′-biotinylated control (CT) or 8-oxodG (8-OG) 37mer oligonucleotides were hybridized by incubating with the complementary oligonucleotide in annealing buffer for 10 min at 75 °C. Equal amounts of duplexes were then immobilized onto anti-biotin antibody labeled agarose beads and then incubated with purified RPS3 and p53 proteins as shown. After washing the beads, DNA-protein complexes were eluted into Laemmli sample buffer and resolved on SDSPAGE followed by electrotransfer on to nitrocellulose membranes which were subsequently blotted with RPS3 and p53 antibodies. (B) Reactions containing CT or 8-OG duplex oligonucleotides and purified RPS3 and MDM2 proteins were processed as described in (A) and analyzed for interactions by immunoblotting the membranes with RPS3 and MDM2 antibodies. (C) DNA oligonucleotides pull-down assays were carried out by mixing CT or 8-OG duplex oligonucleotides with RPS3, MDM2 and p53 proteins as shown, and interactions were analyzed by immunoblotting the membrane with RPS3, MDM2 and p53 antibodies.
Fig. 6
Fig. 6
Effect of RPS3 on in vitro ubiquitination of p53 by MDM2. For the in vitro ubiquitination assay, 500 ng of purified p53 (8 pmol) was mixed with 2 μg of recombinant MDM2 (wild type, 20 pmol) or MDM2 C464S (E3 ubiquitin ligase defective) proteins and added to the ubiquitination reaction containing E1 (4.5 μM), E2 (130 μM) and 1 mg of ubiquitin. The reactions were then incubated with increasing concentrations (2.5, 25, and 250 ng; 5 pmol) of RPS3. p53 ubiquitination was examined by resolving the reactions on SDS-PAGE, transferring on to PVDF membrane and immunoblotting with p53 DO-1 antibody. Light and dark (above and below) exposures of the western blot show p53 laddering, representing ubiquitination.
Fig. 7
Fig. 7
Effect of RPS3 knockdown on cellular MDM2 and p53 levels in HEK 293 Cells. (A) Cells were transfected with non-silencing iRNA (NS) or RPS3 specific iRNA (RPS3) for 24 h and exposed to 0.125 mM H2O2 (>80% survival) for various periods of time, as shown. Whole cell lysates were prepared and 20 μg aliquot of protein extract from each sample was immobilized by SDS-PAGE. After electro-transfer, cellular p53 levels were detected by immunoblot analysis utilizing the mouse monoclonal anti-p53 antibody. The same blot was stripped and re-probed with anti-GAPDH antibody to normalize for the protein loading. After densitometry, integrated density value (IDV) for each protein band was determined and normalized levels of p53 were calculated by dividing the IDV of a protein band by the IDV of the GAPDH within the same sample. (B) Normalized cellular MDM2 levels in the same lysates as in (A) were determined by immunoblotting with an anti-MDM2 antibody and densitometry analysis as described in (A).

References

    1. Coutts AS, Adams CJ, La NB. Thangue p53 ubiquitination by Mdm2: A never ending tail? DNA Repair (Amst) 2009;8:483–490. - PubMed
    1. Vousden KH, Prives C. Blinded by the Light: The Growing Complexity of p53. Cell. 2009;137:413–431. - PubMed
    1. Haupt Y, Maya R, Kazaz A, Oren M. Mdm2 promotes the rapid degradation of p53. Nature. 1997;387:296–299. - PubMed
    1. Honda R, Tanaka H, Yasuda H. Oncoprotein MDM2 is a ubiquitin ligase E3 for tumor suppressor p53. FEBS Lett. 1997;420:25–27. - PubMed
    1. Li M, Brooks CL, Wu-Baer F, Chen D, Baer R, Gu W. Mono- versus polyubiquitination: differential control of p53 fate by Mdm2. Science. 2003;302:1972–1975. - PubMed

Publication types

MeSH terms