. 2009 Nov 15;18(22):4227-38.
doi: 10.1093/hmg/ddp373. Epub 2009 Aug 5.

Imprinting regulates mammalian snoRNA-encoding chromatin decondensation and neuronal nucleolar size

Affiliations

Imprinting regulates mammalian snoRNA-encoding chromatin decondensation and neuronal nucleolar size

Karen N Leung et al. Hum Mol Genet. .

Abstract

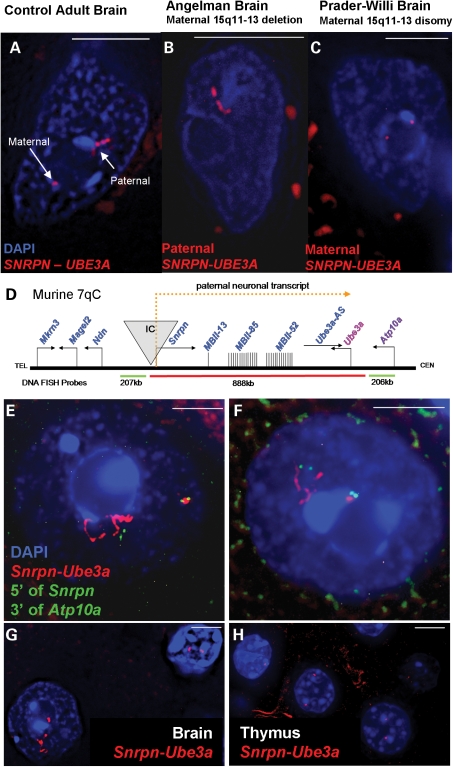
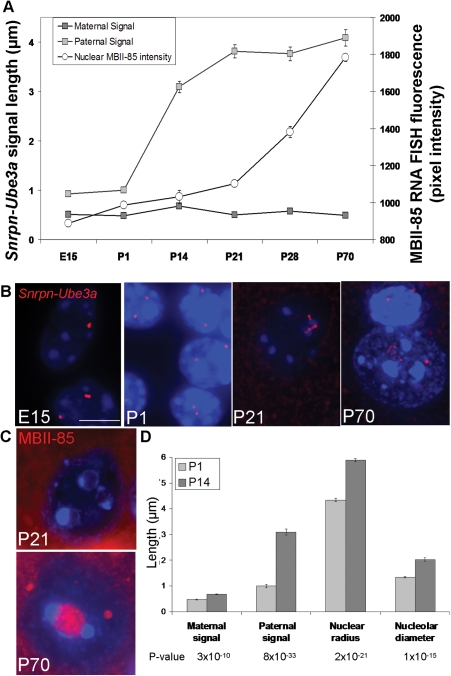
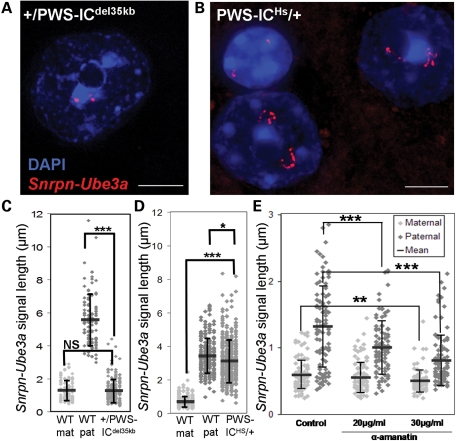
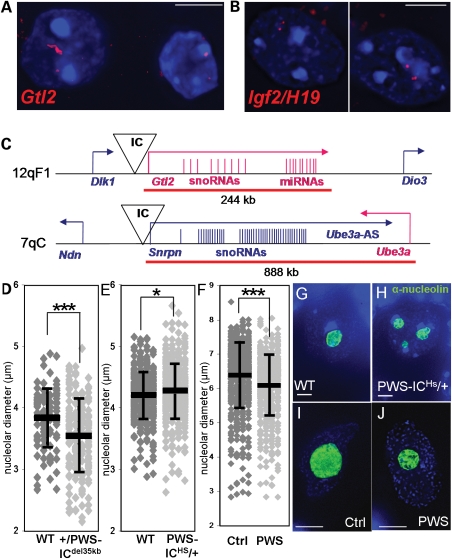
Imprinting, non-coding RNA and chromatin organization are modes of epigenetic regulation that modulate gene expression and are necessary for mammalian neurodevelopment. The only two known mammalian clusters of genes encoding small nucleolar RNAs (snoRNAs), SNRPN through UBE3A(15q11-q13/7qC) and GTL2(14q32.2/12qF1), are neuronally expressed, localized to imprinted loci and involved in at least five neurodevelopmental disorders. Deficiency of the paternal 15q11-q13 snoRNA HBII-85 locus is necessary to cause the neurodevelopmental disorder Prader-Willi syndrome (PWS). Here we show epigenetically regulated chromatin decondensation at snoRNA clusters in human and mouse brain. An 8-fold allele-specific decondensation of snoRNA chromatin was developmentally regulated specifically in maturing neurons, correlating with HBII-85 nucleolar accumulation and increased nucleolar size. Reciprocal mouse models revealed a genetic and epigenetic requirement of the 35 kb imprinting center (IC) at the Snrpn-Ube3a locus for transcriptionally regulated chromatin decondensation. PWS human brain and IC deletion mouse Purkinje neurons showed significantly decreased nucleolar size, demonstrating the essential role of the 15q11-q13 HBII-85 locus in neuronal nucleolar maturation. These results are relevant to understanding the molecular pathogenesis of multiple human neurodevelopmental disorders, including PWS and some causes of autism.


Figures

Figure 1.
Figure 1.
DNA FISH using a probe contig spanning SNRPN–UBE3A (red fluorescence) on post-mortem human and mouse brain samples reveals two distinct parental chromatin structures in neuronal nuclei, counterstained with DAPI (blue fluorescence). White bar represents 5 µm. (A) Representative control adult neuronal nucleus containing a small maternal SNRPN–UBE3A signal and an extended paternal SNRPN–UBE3A signal. (B) Representative Angelman (maternal 15q11–q13 deletion) neuronal nucleus containing a single extended paternal SNRPN–UBE3A signal. (C) Representative Prader–Willi (maternal disomy) neuronal nucleus with two small maternal SNRPN–UBE3A signals. (D) Neuron-specificity and locus boundaries of chromatin decondensation for murine 7qC (syntenic to human 15q11–q13). A diagram of the Snrpn–Ube3a locus showing paternally expressed genes in blue, maternally expressed genes in red, components of the paternal neuronal transcript in yellow and the imprinting center (IC) in grey. DNA FISH probes are diagramed below and colored to match probe fluorescence. Not drawn to scale. (E and F) Representative images of the Snrpn–Ube3a signals seen in mouse adult neuronal nuclei throughout the brain. Red fluorescence shows a decondensed Snrpn–Ube3a paternal signal and a small compact Snrpn–Ube3a maternal signal corresponding to the transcriptional activity of the alleles. The small green signals are the combined flanking probes 5′ of Snrpn and 3′ of Atp10a. While signal length was variable between individual nuclei, paternal signals averaged ∼4 µm and maternal signals averaged ∼0.5 µm in Purkinje, hindbrain and cortical neurons in adult murine brain (Supplementary Material, Fig. S3). Distances between the flanking probes on each Snrpn–Ube3a allele were utilized to determine the percentage of paternal signals which loop back on to the chromosomal backbone by using the average distance between the flanking probes on the maternal allele plus one standard deviation (1.13 µm + 0.58 = 1.71 µm) as a threshold for looping for the paternal allele. Over 43% of the paternal Snrpn–Ube3a alleles looped back to the IC by this definition as shown by these representative nuclei. (G) Paternally extended Snprn–Ube3a signals are neuron-specific as can be seen in this representative image in which the adult neuronal nucleus shows the decondensed allele (bottom left), whereas only two small signals are seen in the glial nucleus (upper right). (H) No decondensed signals were seen in any other adult tissue (thymus, kidney, spleen, liver), thymus nuclei shown.
Figure 2.
Figure 2.
Decondensation of the paternal Snrpn–Ube3a allele is developmentally regulated and correlates to nucleolar enlargement during neuronal maturation. (A) Snrpn–Ube3a DNA FISH probe was hybridized to samples of cerebral cortex of mice aged embryonic day 15 (E15) through post-natal day 70 (P70). Decondensation of the paternal Snrpn–Ube3a allele increases after birth (P1) and precedes increased MBII-85 accumulation (quantified from MBII-85 RNA FISH fluorescence from neuronal nuclei), whereas the maternal allele remains relatively compact throughout development. By P70 the paternal allele is only slightly more compact than a 30 nm fiber and 8-fold longer than the maternal allele (Supplementary Material, Fig. S7). Results represent the mean ± SEM for 100 nuclei per time point. (B) Representative images of Snrpn–Ube3a DNA FISH signals in neuronal nuclei through development: E15, P1, P21 and P70. P70 includes a neuronal nucleus (below) and a glial nucleus (above). (C) Representative images of increased MBII-85 RNA FISH in neuronal nuclei from a P21 nucleus with three small nucleoli and a P70 nucleus with a single large nucleolus in which higher levels of MBII-85 accumulate. (D) Decondensation of the paternal Snrpn–Ube3a allele at P14 corresponds with increases in nuclear (nuclear radius) and nucleolar size (nucleolar diameter), which continue to increase through development (Supplementary Material, Fig. S4). Results represent the mean ± SEM for 100 nuclei/time point. Student's t-test, two tailed. P-values listed below.
Figure 3.
Figure 3.
Transcription is required for paternal Snrpn–Ube3a chromatin decondensation. (A) Representative image of a paternally inherited PWS-IC deletion (+/PWS-ICdel35 kb) neuronal nucleus with two small Snrpn–Ube3a DNA FISH signals due to lack of paternal transcript expression (36). (B) Representative image of two maternally inherited human PWS-IC (PWS-ICHs/+) neurons with two decondensed Snrpn–Ube3a DNA FISH signals due to lack of maternal IC methylation (37). Glial nucleus (upper left) with two small signals. (C) Snrpn–Ube3a signal measurements from +/PWS-ICdel35 kb mouse brain and wild-type (WT mat, WT pat) littermate. Results represent the mean (black bars) ± SD for 100 nuclei/genotype. Student's t-test, two tailed. ***P = 0.000071, NS=not significant. (D) Snrpn–Ube3a signal measurements from PWS-ICHs/+ mouse brain and wild-type littermates; 200 nuclei/genotype. Student's t-test. *P = 0.0027, ***P = 5 × 10−137. +/PWS-ICdel35 kb and PWS-ICHs/+ mice were not directly compared with one another as they are bred on different genetic backgrounds. (E) Murine primary neurons treated for 4 h with the transcriptional inhibitor, α-amanitin, were hybridized with the Snrpn–Ube3a DNA FISH probe and signals measured. Transcriptional inhibition specifically decreased the size of the paternal signal with 20 µg/ml α-amanitin treatment, whereas both signals decreased significantly with 30 µg/ml α-amanitin; 50 nuclei per treatment. Student's t-test. **P < 0.005, ***P < 0.0001.
Figure 4.
Figure 4.
Allele-specific chromatin decondensation also seen at another imprinted cluster of snoRNAs. (AC) The Gtl2 locus, containing imprinted clusters of snoRNAs, reveals similar levels of allele-specific and neuron-specific chromatin decondensation. (A) Representative image of an extended Gtl2 FISH signal (red) for one allele (presumed maternal) in adult murine neuronal nuclei (left nucleus), but not glial nuclei (right nucleus). (B) All other loci tested showed only small signals in neuronal nuclei. Representative image of Igf2/H19 (red), an imprinted locus expressed in brain but without extended chromatin decondensation. (C) Diagram of the imprinted regions of murine 12qF1 and 7qC. Bars and arrows in blue indicate paternally expressed transcripts, whereas pink indicates maternally expressed transcripts. Red lines indicate the location of the DNA FISH probe used. Not to scale. (D) +/PWS-ICdel35 kb Purkinje neurons, lacking snoRNA expression, display significantly smaller nucleoli than their wild-type littermate's Purkinje neurons, correlating to the lack of MBII-85 expression localized to nucleoli. Results represent the mean (black bars) ± SD for 100 nuclei per genotype. Student's t-test, two tailed. ***P < 0.0001. (E) PWS-ICHs/+ Purkinje neurons, with twice the levels of snoRNA expression, display significantly larger nucleoli than their wild-type littermate's Purkinje neurons; 350–400 nuclei/genotype. *P < 0.05. PWS-ICHs/+ Purkinje neurons also had significantly more nucleoli (12.5% had more than one nucleolus) than wild-type littermates (4.45% containing more then one nucleolus), P < 0.00001. (F) Purkinje neurons from PWS individuals also display significantly smaller nucleoli than age-matched controls; 100 nuclei/individual (six controls, five PWS samples). ***P < 0.0001. (G) Representative image of a murine wild-type Purkinje nucleus (DAPI counterstain, blue) with a single large nucleolus (α-nucleolin staining, green). (H) Representative image of a murine PWS-ICHs/+ Purkinje nucleus with multiple nucleoli. (I) Representative image of a human control Purkinje nucleus with a single large nucleolus. (J) Representative image of a PWS Purkinje nucleus with a single smaller nucleolus. White bars represents 5 µm.

References

    1. Mehler M.F., Mattick J.S. Noncoding RNAs and RNA editing in brain development, functional diversification, and neurological disease. Physiol. Rev. 2007;87:799–823. - PubMed
    1. Wilkinson L.S., Davies W., Isles A.R. Genomic imprinting effects on brain development and function. Nat. Rev. Neurosci. 2007;8:832–843. - PubMed
    1. Mercer T.R., Dinger M.E., Mariani J., Kosik K.S., Mehler M.F., Mattick J.S. Noncoding RNAs in long-term memory formation. Neuroscientist. 2008;14:434–445. - PubMed
    1. Morison I.M., Ramsay J.P., Spencer H.G. A census of mammalian imprinting. Trends Genet. 2005;21:457–465. - PubMed
    1. Chambeyron S., Da Silva N.R., Lawson K.A., Bickmore W.A. Nuclear re-organisation of the Hoxb complex during mouse embryonic development. Development. 2005;132:2215–2223. - PubMed

Publication types

MeSH terms