. 2009 Oct;20(19):4131-9.
doi: 10.1091/mbc.e09-05-0359. Epub 2009 Aug 5.

Function and assembly of DNA looping, clustering, and microtubule attachment complexes within a eukaryotic kinetochore

Affiliations

Function and assembly of DNA looping, clustering, and microtubule attachment complexes within a eukaryotic kinetochore

Marybeth Anderson et al. Mol Biol Cell. 2009 Oct.

Abstract

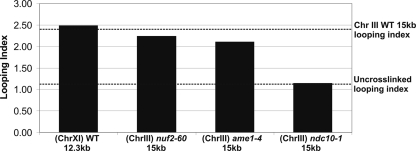
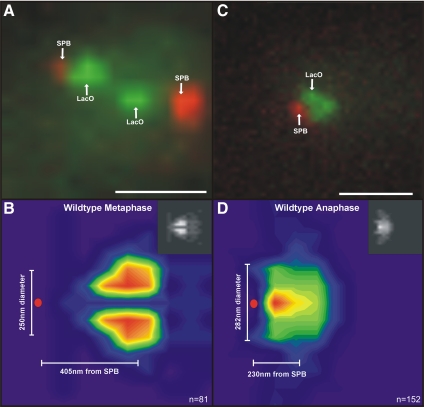
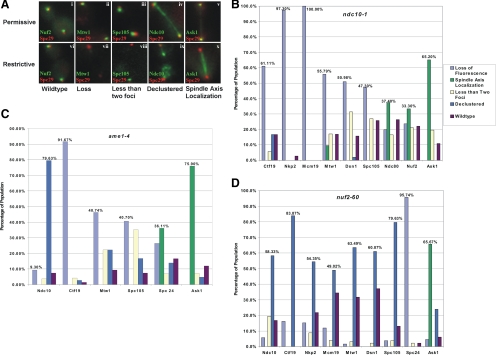
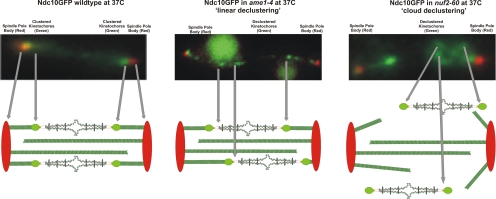
The kinetochore is a complex protein-DNA assembly that provides the mechanical linkage between microtubules and the centromere DNA of each chromosome. Centromere DNA in all eukaryotes is wrapped around a unique nucleosome that contains the histone H3 variant CENP-A (Cse4p in Saccharomyces cerevisiae). Here, we report that the inner kinetochore complex (CBF3) is required for pericentric DNA looping at the Cse4p-containing nucleosome. DNA within the pericentric loop occupies a spatially confined area that is radially displaced from the interpolar central spindle. Microtubule-binding kinetochore complexes are not involved in pericentric DNA looping but are required for the geometric organization of DNA loops around the spindle microtubules in metaphase. Thus, the mitotic segregation apparatus is a composite structure composed of kinetochore and interpolar microtubules, the kinetochore, and organized pericentric DNA loops. The linkage of microtubule-binding to centromere DNA-looping complexes positions the pericentric chromatin loops and stabilizes the dynamic properties of individual kinetochore complexes in mitosis.


Figures

Figure 1.
Figure 1.
Kinetochore protein requirements for centromere-loop formation. The looping index accounts for differential efficiency of PCR reactions with primers for pericentric chromatin versus chromosome arms at an equivalent ratio of input DNA. The pericentric region of chromosome III has a looping index of 2.4 (dotted line) (Yeh et al., 2008). Experimental samples (wild-type [WT], ndc10-1, ame1-4, and nuf2-60) were prepared as described previously (Yeh et al., 2008). Temperature-sensitive mutants were shifted to restrictive temperature (37°C) for 3 h before cross-linking. Random chromosomal association by using uncross-linked DNA has a looping index of 1.1 (dotted line).
Figure 2.
Figure 2.
Density maps of pericentric LacO to visualize the geometric arrangement of pericentric chromatin in metaphase and anaphase. The average position of 10-kb LacO DNA arrays integrated 1.8 kb from CEN15 was determined in metaphase and anaphase spindles in vivo. Metaphase (A) and anaphase (C) spindles are shown top left and right, respectively. Bar, 1 um. Spindle pole bodies are in red (Spc29-RFP), and separated pericentric LacO arrays are in green. The peak intensity (pixel) of each diffraction limited LacO foci was determined and the coordinates of the brightest pixel of each spot were plotted relative to the spindle pole body. The number and position of LacO foci were used to generate a positional heat map representing the range of motion of pericentric LacO array relative to the spindle pole (metaphase, B; anaphase D). The frequency distribution of the brightest LacO pixel is indicated in the color coded heat map below with red and orange the most likely and blue and purple least likely (metaphase, n = 81; anaphase, n = 152). B and D, insets, the insets in the top right are gray-scale density maps of the data plotted with rainbow hues. The gray-scale reduces artifacts due to the differential visual sensitivity to red, green, and blue color spectrum (Borland and Taylor, 2007).
Figure 3.
Figure 3.
Functional autonomy of kinetochore complexes. (A) Classes of kinetochore localization patterns observed using fluorescence microscopy. The protein components used to represent each kinetochore complex in this experiment are as follows: CBF3: Ndc10p; COMA: Ctf19p, Nkp2p, Mcm19p; MIND: Mtw1p, Dsn1p; SPC105: Spc105p; NDC80: Nuf2p, Spc24p, Ndc80p; and DAM-DASH: Ask1p. Each kinetochore protein-GFP fusion is shown in green, whereas spindle pole bodies (Spc29-RFP) are shown in red. Boxes i–v represent kinetochore protein localization in wild-type and temperature sensitive mutants (i, wt; ii, ndc10-1; iii, ndc10-1; iv, nuf2-60; and v, ndc10-1) grown at permissive temperature (25°C). Cells in late anaphase are shown for comparison. Boxes vi–x represents kinetochore protein localization in wild-type and temperature-sensitive mutants (vi, wt; vii, ndc10-1; viii, ndc10-1; ix, nuf2-60; and x, ndc10-1) grown at restrictive temperature (37°C) for 3 h. (B) Kinetochore protein localization in ndc10-1 mutants grown at restrictive temperature (37°C). The complete phenotype is indicated for each kinetochore protein GFP fusion (indicated on abscissa). The percentages on the graph highlight the predominant phenotype of each protein. The inner kinetochore proteins (COMA and MIND) were principally lost, whereas outer kinetochore proteins (NDC80 and DAM-DASH) redistributed to the spindle axis. (C) Kinetochore protein localization in ame1-4 mutants grown at restrictive temperature (37°C). The inner kinetochore proteins displayed either a loss of fluorescence or a declustered localization pattern. The outer kinetochore proteins Spc24p and Ask1p displayed spindle axis localization in the majority of the population. A different member of the COMA complex, Ctf19p, was undetected, indicating a complete loss of COMA in ame1-4. (D) Kinetochore protein localization in nuf2-60 mutants grown at restrictive temperature (37°C). The inner kinetochore proteins displayed a declustered phenotype. A different member of the NDC80 complex, Spc24p, was undetected, whereas the outer kinetochore protein Ask1p localized along the spindle axis in the majority of the population observed.
Figure 4.
Figure 4.
Schematic representation of kinetochore declustering (Ndc10-GFP) in inner (ame1-4) versus outer (nuf2-60) kinetochore mutants. Top (left), distribution of Ndc10-GFP in anaphase. Top (center, right), types of Ndc10-GFP declustering events observed in ame1-4 (center) and nuf2-60 (right) indicate differences in the status of microtubule plus-end attachment. Linear declustering is indicative of persistent inner kinetochore protein interactions along the spindle (center). Bottom, individual kinetochore–microtubule attachment sites are organized circumferentially around the spindle microtubules (Yeh et al., 2008). A sagittal cross section of this organization in illustrated beneath each fluorescence image. Kinetochore proteins and pericentric chromatin are no longer restrained to the spindle axis in nuf2-60 (top and bottom right). Loss of kinetochore clustering in ame1-4 results in dispersion of kinetochore proteins along the spindle axis (center). Cloud declustering is indicative of loss of microtubule binding (right).
Figure 5.
Figure 5.
In vivo dynamics of kinetochore components. Top (left), pre- and postbleach images of Mtw1-GFP in nuf2-60 cells at the restrictive temperature (37°C). Top (right), FRAP was detected within 20s after photobleaching (diamonds). Fluorescence loss of unbleached Mtw1-GFP is shown (squares). (Below) FRAP recovery values (percentage of kinetochore clusters that exhibit recovery, percentage of recovery, and recovery half-life) are shown for Ctf19p, Mtw1p, and Ndc10p in nuf2-60 and Ask1p, Spc105p, and Nuf2p in ndc10-1. Thirty-eight of 43 (88.4%) of kinetochore clusters showed an average recovery of 70 ± 9.67%, with a half-life of 49.5 ± 13.15 s.
Figure 6.
Figure 6.
Pre- and postbleach images of Nuf2-GFP (top) and Cse4-GFP (bottom) after cell cycle assembly. Prebleach sister kinetochore clusters of both Nuf2-GFP and Cse4-GFP in a single late anaphase/telophase cell (left). Postbleach image in late anaphase/telophase of the mother kinetochore cluster using a 200-ms laser exposure (center). Postbleach recovery of Nuf2-GFP and Cse4-GFP fluorescence in the mother kinetochore cluster after the mother cell budded, whereas the daughter remained unbudded. Arrow marks new bud.

References

    1. Bi E., Pringle J. R. ZDS1 and ZDS2, genes whose products may regulate Cdc42p in Saccharomyces cerevisiae. Mol. Cell Biol. 1996;16:5264–5275. - PMC - PubMed
    1. Borland D., Taylor R. M., II Rainbow color map (still) considered harmful. IEEE Comput. Graph. Appl. 2007;March/April:14–17. - PubMed
    1. Bouck D. C., Joglekar A. P., Bloom K. S. Design features of a mitotic spindle: balancing tension and compression at a single microtubule kinetochore interface in budding yeast. Annu. Rev. Genet. 2008;42:335–359. - PMC - PubMed
    1. Cheeseman I. M., Desai A. Molecular architecture of the kinetochore-microtubule interface. Nat. Rev. Mol. Cell Biol. 2008;9:33–46. - PubMed
    1. De Wulf P., McAinsh A. D., Sorger P. K. Hierarchical assembly of the budding yeast kinetochore from multiple subcomplexes. Genes Dev. 2003;17:2902–2921. - PMC - PubMed

Publication types

MeSH terms

LinkOut - more resources