

Multi-scale models of cell and tissue dynamics
- PMID: 19657010
- PMCID: PMC3263796
- DOI: 10.1098/rsta.2009.0095
Multi-scale models of cell and tissue dynamics
Abstract
Cell and tissue movement are essential processes at various stages in the life cycle of most organisms. The early development of multi-cellular organisms involves individual and collective cell movement; leukocytes must migrate towards sites of infection as part of the immune response; and in cancer, directed movement is involved in invasion and metastasis. The forces needed to drive movement arise from actin polymerization, molecular motors and other processes, but understanding the cell- or tissue-level organization of these processes that is needed to produce the forces necessary for directed movement at the appropriate point in the cell or tissue is a major challenge. In this paper, we present three models that deal with the mechanics of cells and tissues: a model of an arbitrarily deformable single cell, a discrete model of the onset of tumour growth in which each cell is treated individually, and a hybrid continuum-discrete model of the later stages of tumour growth. While the models are different in scope, their underlying mechanical and mathematical principles are similar and can be applied to a variety of biological systems.
Figures
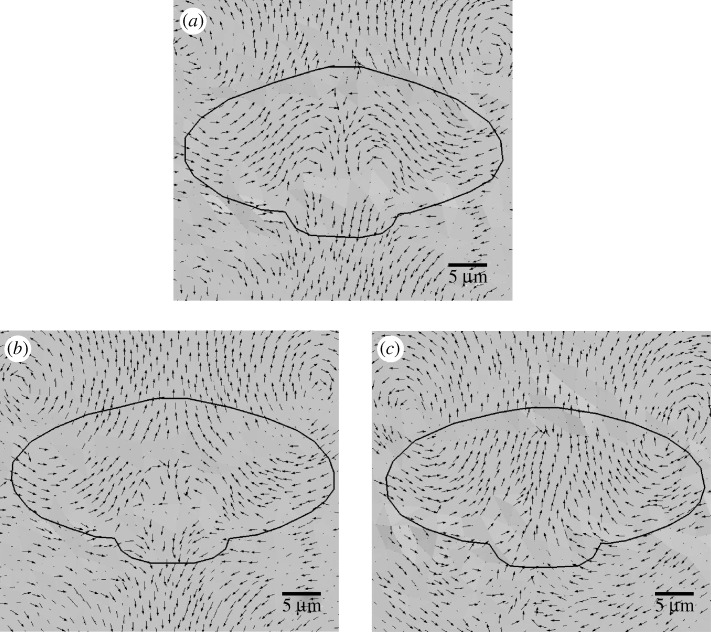
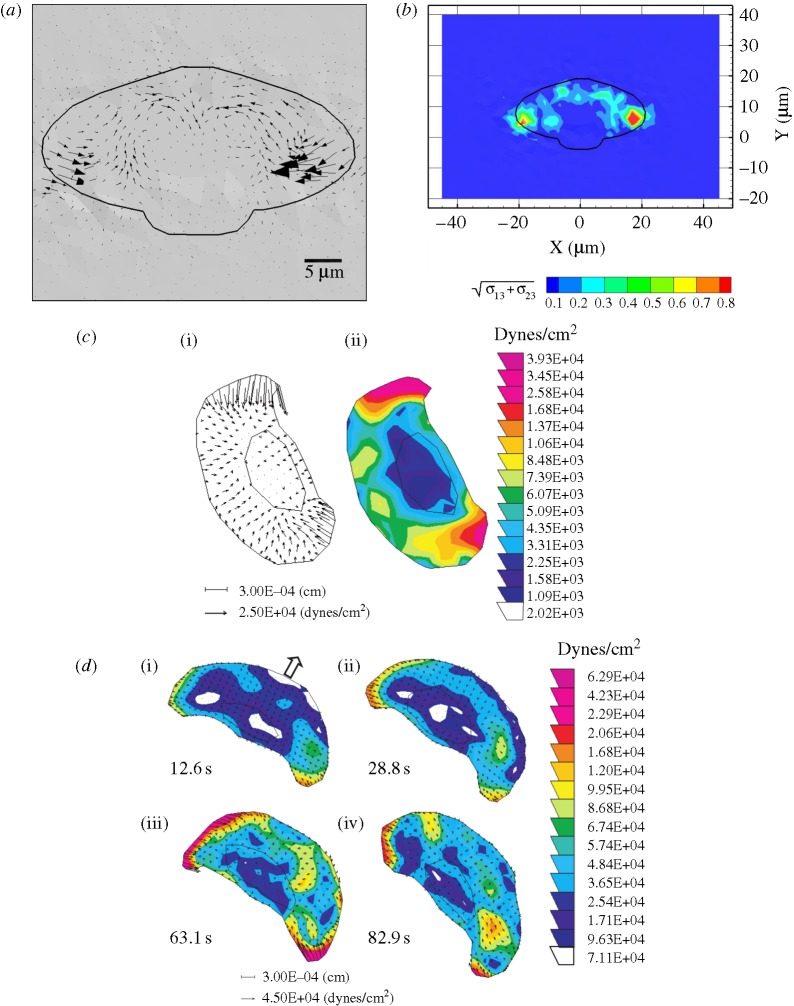
 in kPa) acting on the substrate at the cell–substrate interface for a substrate stiffness of 2 kPa. (c) Experimentally determined maximum shear traction vectors (i) and magnitudes (ii) from Doyle et al. (2004). (d) Time course of traction magnitudes as measured in Doyle et al. (2004). (1 kPa=1×10⁴ dyne cm−2.)
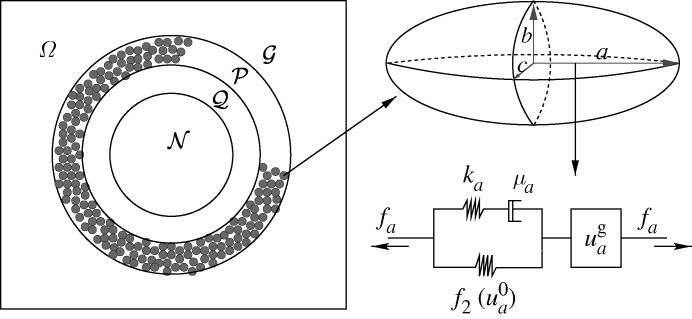
 . (Reprinted from Kim et al. (2007), with permission.)
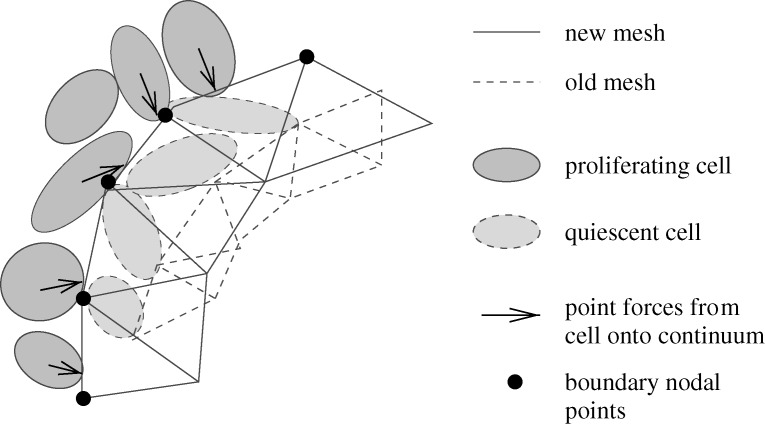
 , where
  is the distance from the ith node point on the
  interface to the tumour centre and
  is the number of nodes on the
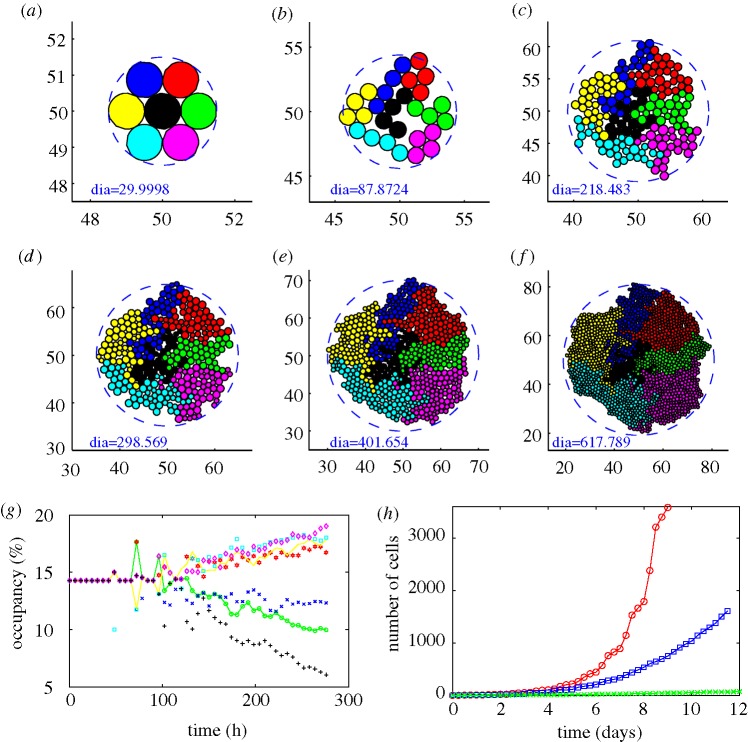
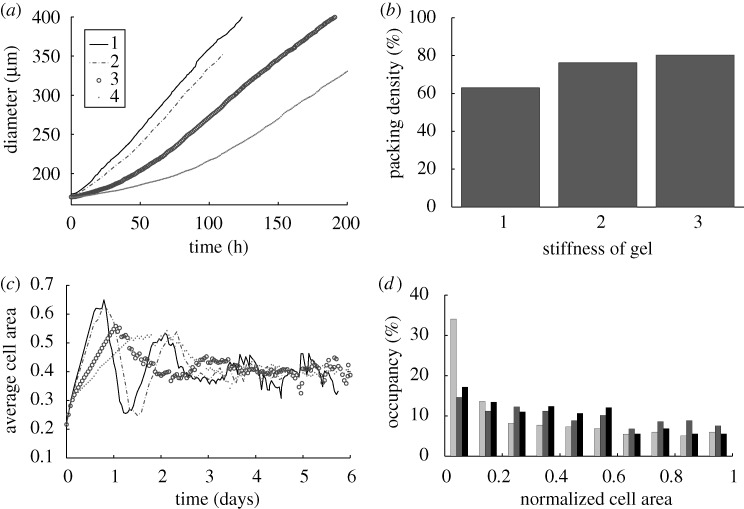
  interface. (b) The effect of gel stiffness on packing density: packing density at 137 h, computed as given in the text. (c) The average cell area Ac(t) (normalized) in the
  region for each case:
  , where
  is the normalized cell area and Nc(t) is the number of cells at time t. Curves as in (a). (d) Area distribution of proliferating cells corresponding to cases 1 (light grey), 3 (dark grey) and 4 (black) in (c) at 137 h.
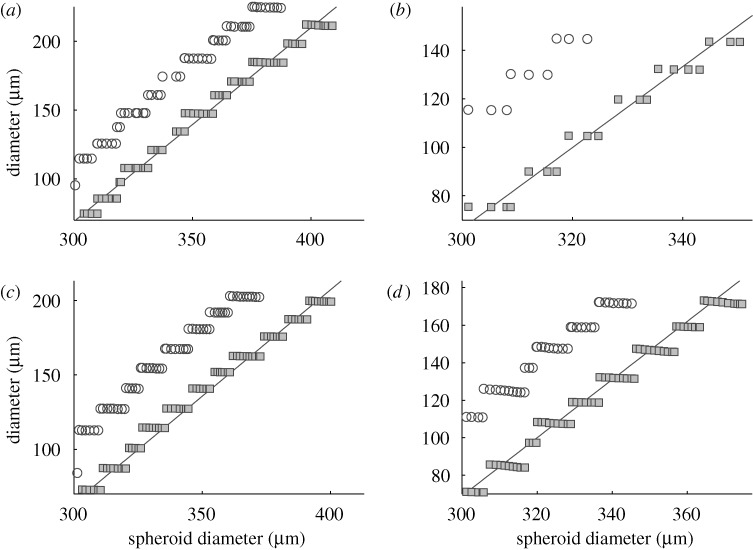
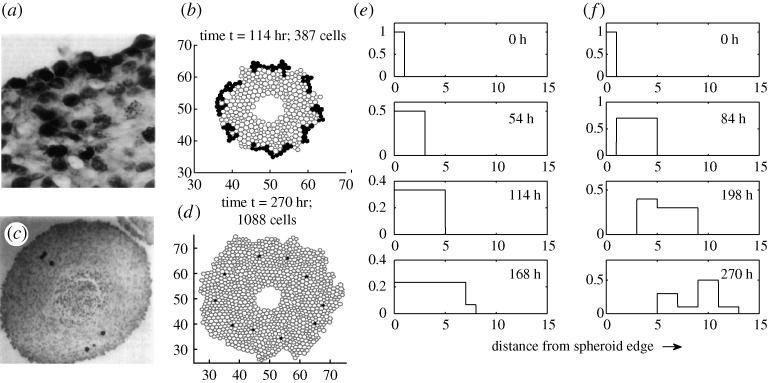
 region. The steps in the computational results arise from the manner in which cells are converted to continuum (Kim et al. 2007).
References
-
- Alberts B., Johnson A., Lewis J., Raff M., Roberts K., Walter P. 2002. Molecular biology of the cell, 4th edn. New York, NY: Garland.
-
- Ambrosi D., Mollica F. 2002. On the mechanics of a growing tumour. Int. J. Eng. Sci. 40, 1297–1316. ( 10.1016/S0020-7225(02)00014-9) - DOI
Publication types
MeSH terms
LinkOut - more resources
Full Text Sources