. 2009 Sep 13;367(1902):3555-83.
doi: 10.1098/rsta.2009.0100.

Towards a unified theory for morphomechanics

Affiliations

Towards a unified theory for morphomechanics

Larry A Taber. Philos Trans A Math Phys Eng Sci. .

Abstract

Mechanical forces are closely involved in the construction of an embryo. Experiments have suggested that mechanical feedback plays a role in regulating these forces, but the nature of this feedback is poorly understood. Here, we propose a general principle for the mechanics of morphogenesis, as governed by a pair of evolution equations based on feedback from tissue stress. In one equation, the rate of growth (or contraction) depends on the difference between the current tissue stress and a target (homeostatic) stress. In the other equation, the target stress changes at a rate that depends on the same stress difference. The parameters in these morphomechanical laws are assumed to depend on stress rate. Computational models are used to illustrate how these equations can capture a relatively wide range of behaviours observed in developing embryos, as well as show the limitations of this theory. Specific applications include growth of pressure vessels (e.g. the heart, arteries and brain), wound healing and sea urchin gastrulation. Understanding the fundamental principles of tissue construction can help engineers design new strategies for creating replacement tissues and organs in vitro.


Figures

Figure 1.
Figure 1.
Configurations for a growing body. B is the reference state; B* the current zero-stress state; BR the current unloaded state; b the current loaded state; G the growth tensor; F* the elastic deformation gradient tensor; F the total deformation gradient tensor.
Figure 2.
Figure 2.
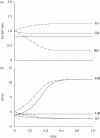
Temporal response of a bar subjected to a fixed 20% stretch. (a) Total (λ) and growth (G) stretch ratios. Solid line λ; dashed line G. (b) Axial stress (σ) and target stress (σ0). Solid line σ; dashed line σ0. GR, growth; HR, hyper-restoration; SA, stretch activation. A=1, B=2 for GR; A=1, B=−2 for HR; A=−1, B=20 for SA.
Figure 3.
Figure 3.
Temporal response of a bar subjected to a fixed 20% shortening. (a) Total (λ) and growth (G) stretch ratios. Solid line λ; dashed line G. (b) Axial stress (σ) and target stress (σ0). Solid line σ; dashed line σ0. GR, growth; HR, hyper-restoration; SA, stretch activation. A=1, B=10 for GR; A=1, B=−10 for HR; A=−1, B=10 for SA.
Figure 4.
Figure 4.
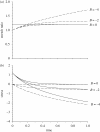
Effects of the morphomechanical ‘overshoot’ parameter B on the temporal hyper-restoration (HR) response of a bar subjected to a fixed 20% stretch. (a) Total (λ) and growth (G) stretch ratios. Solid line λ; dashed line G. (b) Axial stress (σ) and target stress (σ0). Solid line σ; dashed line σ0. A=1 for all curves.
Figure 5.
Figure 5.
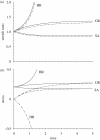
Temporal response of a bar subjected to a constant load (P=0.2). (a) Total (λ) and growth (G) stretch ratios. Solid line λ; dashed line G. (b) Axial stress (σ) and target stress (σ0). Solid line σ; dashed line σ0. GR, growth; HR, hyper-restoration; SA, stretch activation. A=B=1 for GR; A=1, B=−1 for HR; A=−1, B=1 for SA.
Figure 6.
Figure 6.
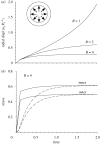
Growth of cylindrical pressure vessel. Specified pressure increases linearly from zero to a peak value pi/C=0.2 at t=0.1 and then remains constant. (a) Displacement ui of inner radius versus time for various values of B (Ri, initial inner radius). For B=1, unbounded growth occurs. (b) Circumferential stress (σθ) and target stress (σθ0) versus time at inner and outer radius for B=4. Solid line σθ; dashed line σθ0. A=1 for all curves.
Figure 7.
Figure 7.
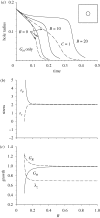
Stretch-activation response for model of wound healing. Model consists of a square membrane under tension with a hole in the centre. (A=−1 and B=0 for all curves unless indicated otherwise.) (a) Radius of hole versus time. Healing rate increases as B decreases. Curve for Gθ only has no radial growth; curve C=1 has constant material modulus. (Modulus increases with circumferential contraction for other cases.) (b) Circumferential stress (σθ) and radial stress (σr) versus undeformed radial coordinate at t=0.12 for solid B=0 curve in (a). (c) Growth stretch ratios (GR and GΘ) in the plane of the membrane and total transverse stretch ratio (λz) versus undeformed radial coordinate at t=0.12 for solid B=0 curve in (a).
Figure 8.
Figure 8.
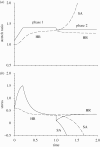
Slow stretch and hold (phase 1) followed by rapid shortening and hold (phase 2) of bar model for axon. (a) Total axial stretch ratio (λ) and growth stretch ratio (G) versus time. Solid line λ; dashed line G. (b) Axial stress (σ) and target stress (σ0) versus time. Solid line σ; dashed line σ0. HR, hyper-restoration; SA, stretch activation. During phase 2, HR response agrees better with experimental data than SA.
Figure 9.
Figure 9.
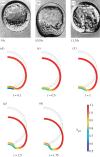
Sea urchin gastrulation. (a)–(c) Sequential cross sections of invaginating embryo (courtesy of J.B. Morrill). (d)–(h) Fluid-filled spherical shell model. Prescribed 50% isotropic contraction in the outer region of the dimple in (d) triggers hyper-restoration response that continues invagination for t>0.1. Colours indicate circumferential growth stretch ratio. A=1, B=−1.
Figure 10.
Figure 10.
Time-dependent results for a shell model of sea urchin gastrulation (see figure 9). (a) Relative vertical displacement at the centre of the dimple (normalized by outer shell radius) for various values of initial contraction. (b) Fluid pressure (pi/C) for 50% contraction rises and then falls to negative values.
Figure 11.
Figure 11.
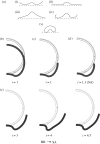
Sea urchin cutting experiment. (a) Sketches of observed response of gastrulating segment of embryo after the top part was removed (from Moore and Burt 1939). (b) Modified intact fluid-filled spherical shell model of figure 9 with no radial growth. (c) Top half of shell is removed at t=1; embryo opens. (d) Shell in (c) continues to deform by stretch-activation response to sudden removal of loads (A=−1, B=1). (e) Shell in (c) continues to deform by gradual transition from hyper-restoration to stretch-activation response (A=1→−1,B=−1→1).

References

    1. Ahmad F. J., Hughey J., Wittmann T., Hyman A., Greaser M., Baas P. W. 2000. Motor proteins regulate force interactions between microtubules and microfilaments in the axon. Nat. Cell Biol. 2, 276–280. (10.1038/35010544) - DOI - PubMed
    1. Alberch P. 1980. Ontogenesis and morphological diversification. Am. Zool. 20, 653–667.
    1. Alford P. W., Humphrey J. D., Taber L. A. 2008. Growth and remodeling in a thick-walled artery model: effects of spatial variations in wall constituents. Biomech. Model. Mechanobiol. 7, 245–262. (10.1007/S10237-007-0101-2) - DOI - PMC - PubMed
    1. Ambrosi D., Guana F. 2007. Stress-modulated growth. Math. Mech. Solids 12, 319–342. (10.1177/1081286505059739) - DOI
    1. Baas P. W., Ahmad F. J. 2001. Force generation by cytoskeletal motor proteins as a regulator of axonal elongation and retraction. Trends Cell Biol. 11, 244–249. (10.1016/S0962-8924(01)02005-0) - DOI - PubMed

Publication types

LinkOut - more resources