. 2009 Aug 5;29(31):9761-70.
doi: 10.1523/JNEUROSCI.4568-08.2009.

Stability of electrical coupling despite massive developmental changes of intrinsic neuronal physiology

Affiliations

Stability of electrical coupling despite massive developmental changes of intrinsic neuronal physiology

Philip R L Parker et al. J Neurosci. .

Abstract

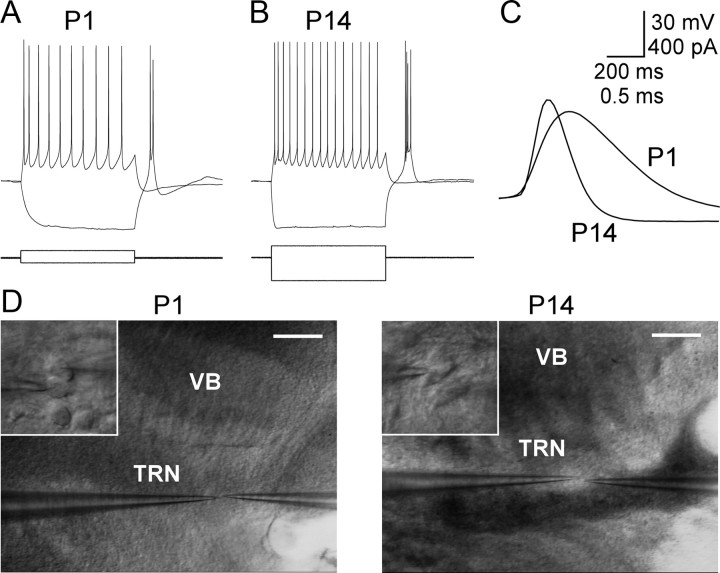
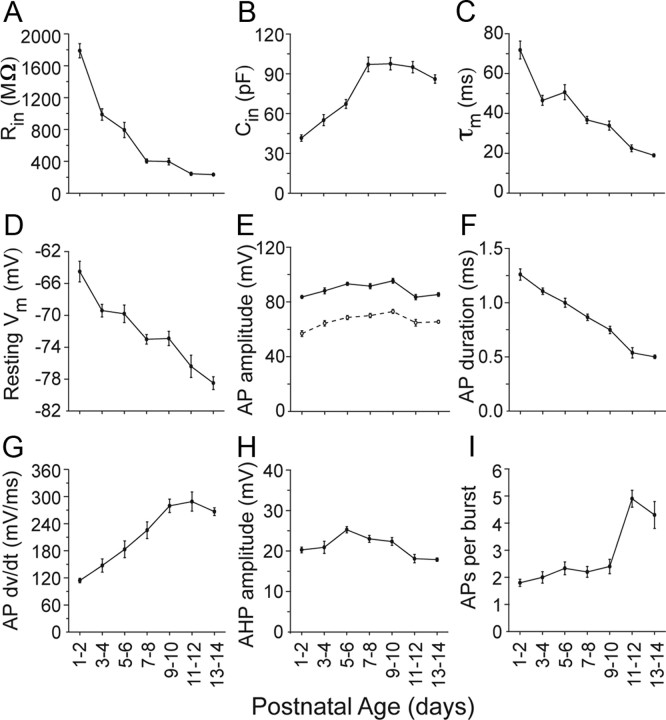
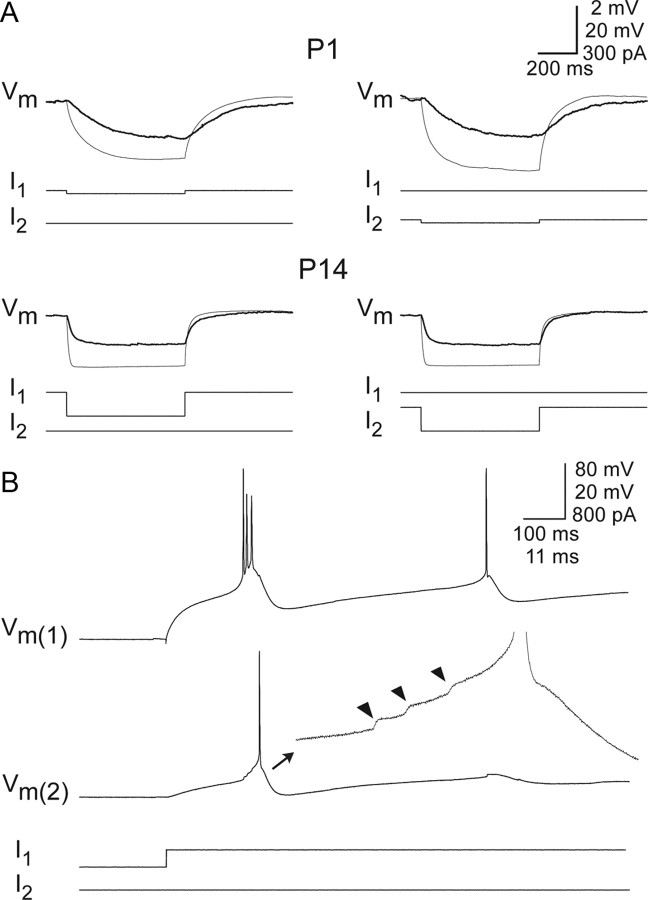
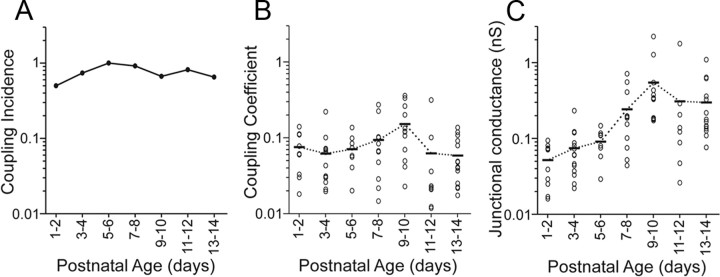
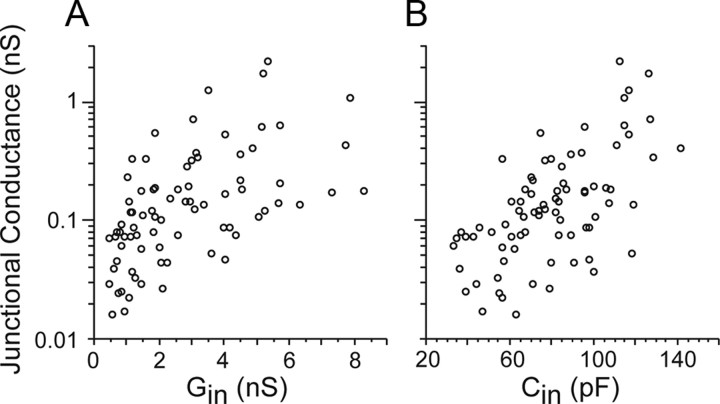
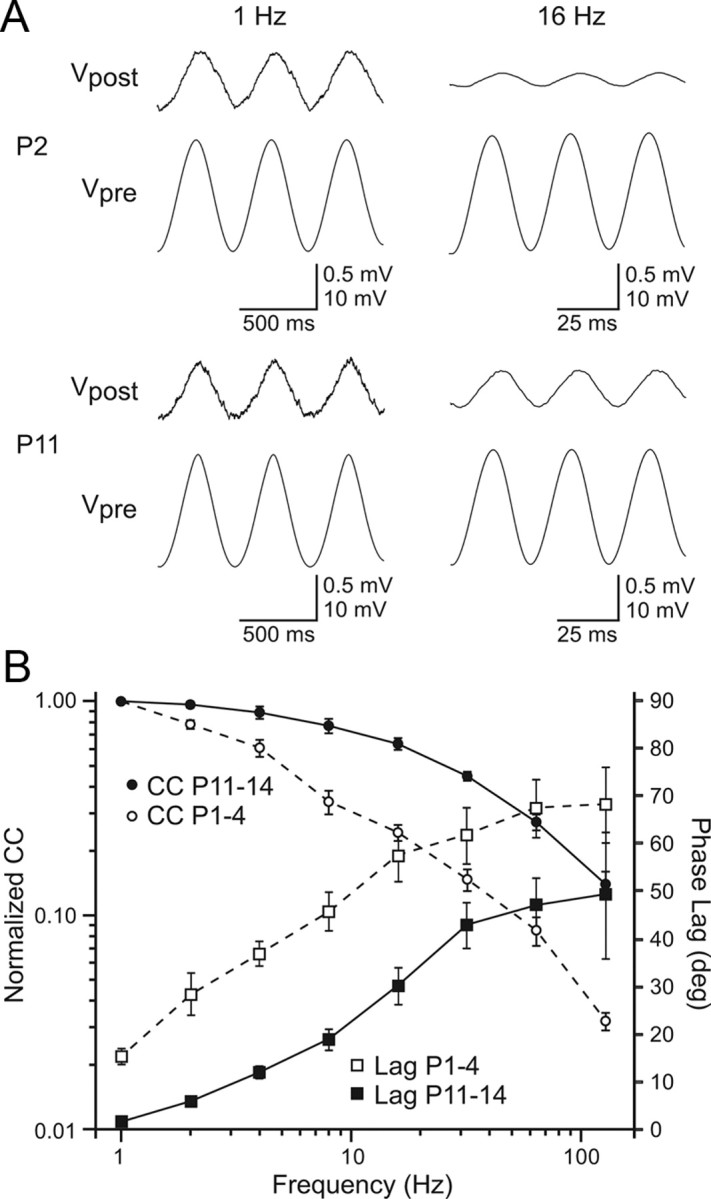
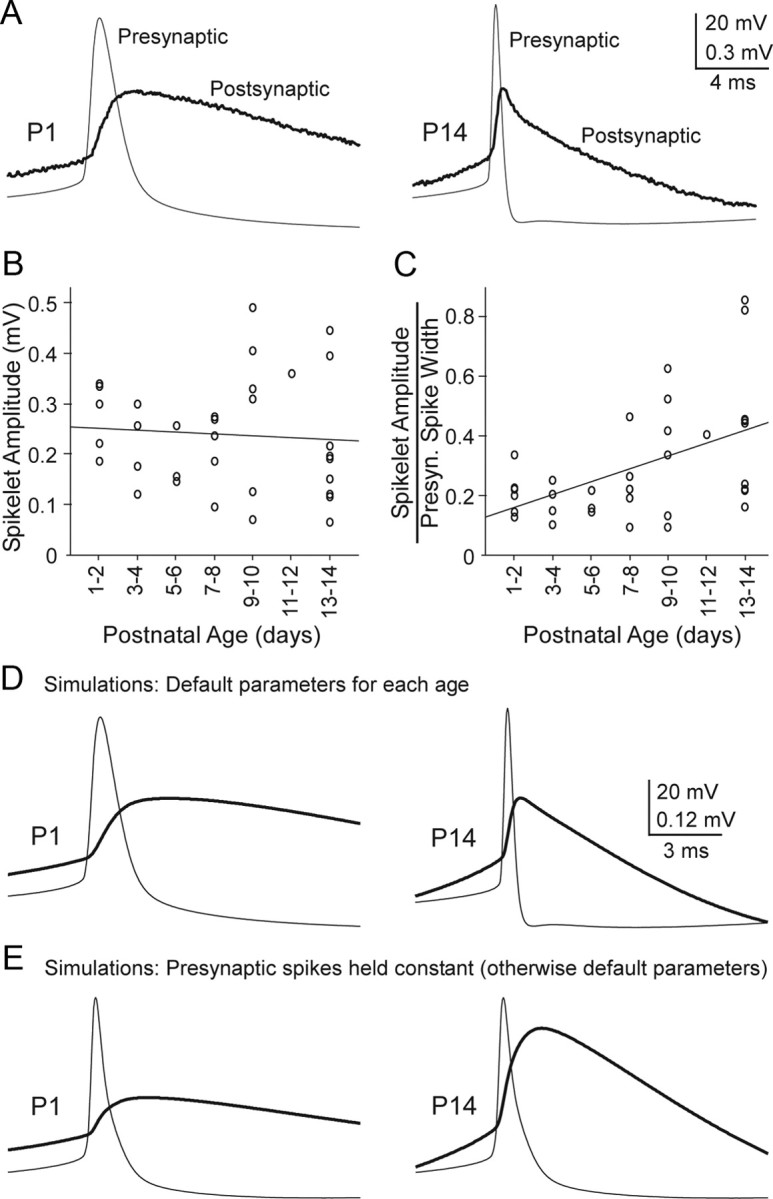
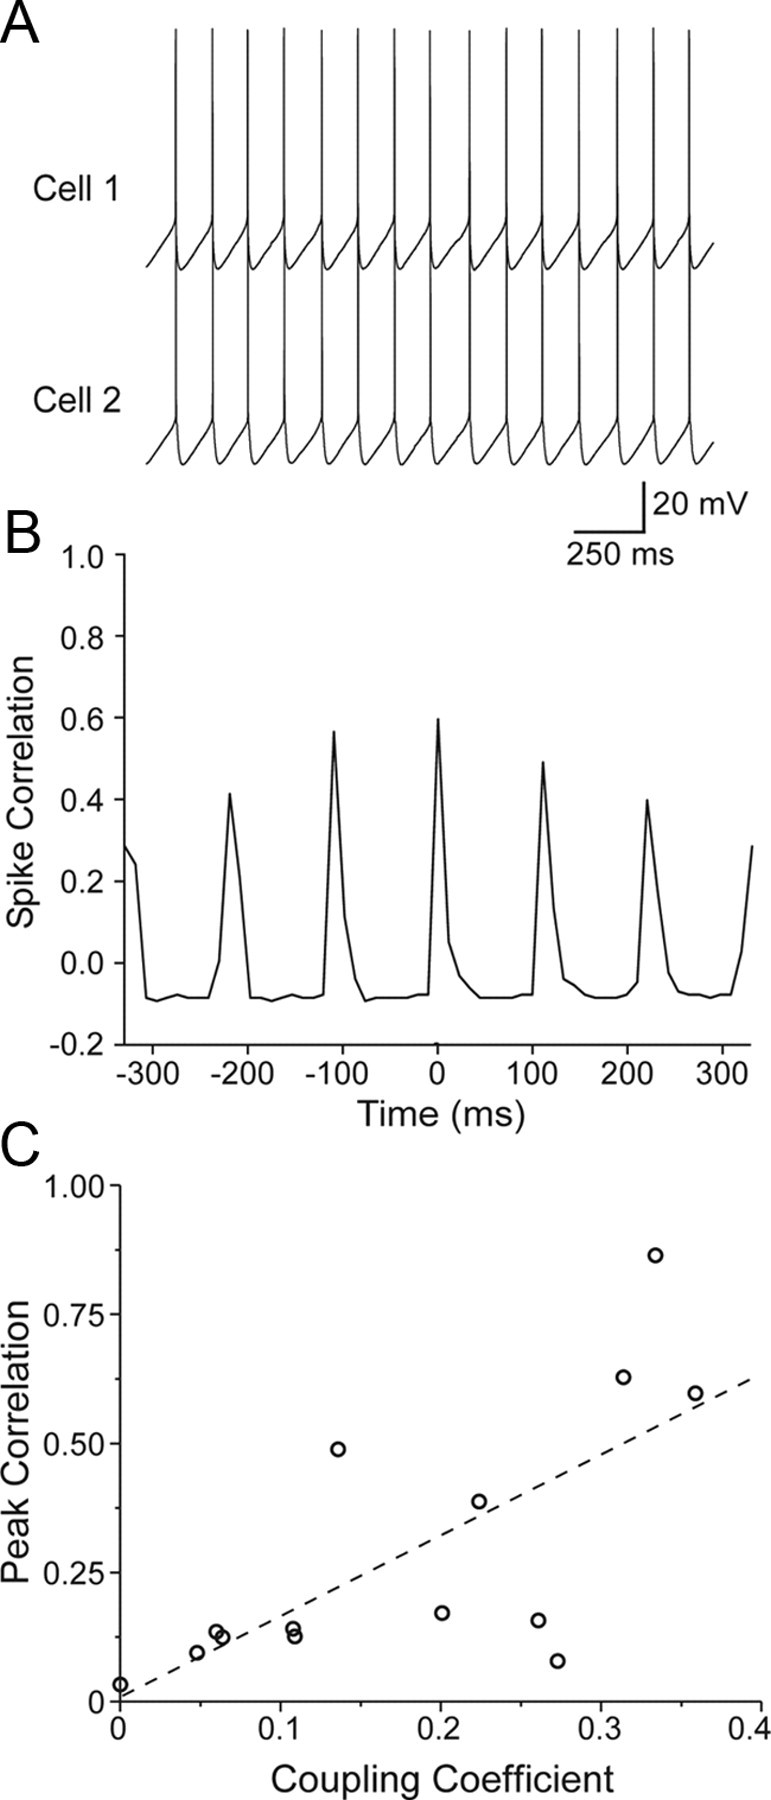
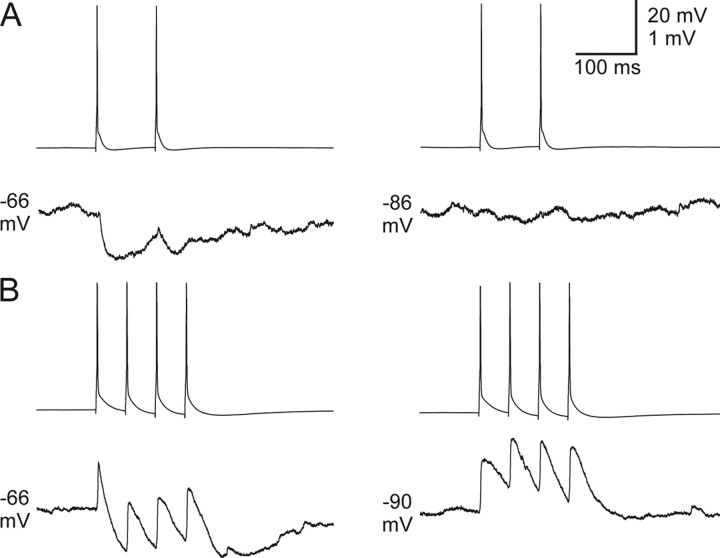
Gap junctions mediate metabolic and electrical interactions between some cells of the CNS. For many types of neurons, gap junction-mediated electrical coupling is most prevalent during early development, then decreases sharply with maturation. However, neurons in the thalamic reticular nucleus (TRN), which exert powerful inhibitory control over thalamic relay cells, are electrically coupled in relatively mature animals. It is not known whether TRN cells or any neurons that are electrically coupled when mature are also coupled during early development. We used dual whole-cell recordings in mouse brain slices to study the postnatal development of electrical and chemical synapses that interconnect TRN neurons. Inhibitory chemical synapses were seen as early as postnatal day 4 but were infrequent at all ages, whereas TRN cells were extensively connected by electrical synapses from birth onward. Surprisingly, the functional strength of electrical coupling, assayed under steady-state conditions or during spiking, remained relatively constant as the brain matured despite dramatic concurrent changes of intrinsic membrane properties. Most notably, neuronal input resistances declined almost eightfold during the first two postnatal weeks, but there were offsetting increases in gap junctional conductances. This suggests that the size or number of gap junctions increase homeostatically to compensate for leakier nonjunctional membranes. Additionally, we found that the ability of electrical synapses to synchronize high frequency subthreshold signals improved as TRN cells matured. Our results demonstrate that certain central neurons may maintain or even increase their gap junctional communication as they mature.


Figures

Figure 1.
Figure 1.
Neurons of the TRN at P1 and P14. A, Voltage responses of a P1 TRN cell (top) to intracellular current pulses (bottom). The steady-state membrane potential was −69 mV. A small negative current (40 pA) induced a >30 mV hyperpolarization. Offset of the negative current evoked a burst with 2 action potentials. A small positive current (60 pA) evoked tonic spiking. B, A P14 cell. The steady-state membrane potential was −69 mV. Larger current pulses were necessary at P14 than P1 because of lower input resistance in the older cell (−200 pA and 100 pA). Note the faster initial voltage response to current onset in the P14 cell, reflecting a faster τm. The number of action potentials evoked during the offset burst was greater in the P14 than the P1 cell. C, Action potential durations were briefer in the P14 than in the P1 cell because of faster rise and decay rates. D, IR-Differential interference contrast images from paired cell recording in TRN from P1 and P14 brain slices (recordings in A–C are from the cells shown in D). Insets show cells at high magnification. Scale bars in D are 200 μm (low magnification) and 20 μm (high magnification).
Figure 2.
Figure 2.
Changing intrinsic properties of TRN neurons across development. A, Rin decreased nearly eightfold during the first two postnatal weeks. B, Cin doubled. C, τm, affected by both Rin and Cin, decreased nearly fourfold. D, The resting membrane potential hyperpolarized across ages, crossing the tonic/burst firing mode threshold. E, Action potential (AP) amplitude was relatively constant across ages when measured from either the resting potential (solid circles) or from AP threshold (open circles). F, AP durations, measured at half of the maximum amplitude, became briefer in older animals. G, The maximum rate of rise of APs increased across age. H, Amplitudes of the spike afterhyperpolarizations (AHPs) were relatively constant. I, A sudden increase in the number of spikes per burst was seen between P9–10 and P11–12. Linear regression analysis revealed statistically significant effects of age (p < 0.05) for all of the intrinsic and spiking properties plotted here except AP amplitude when measured from baseline (E, solid line).
Figure 3.
Figure 3.
Electrical coupling in the immature TRN. A, Example of electrical coupling between pairs of cells in P1 (top) and P14 (bottom) mice. For each cell pair, traces corresponding to current injection into one cell (cell 1) are shown on left, and traces corresponding to injections into the other cell (cell 2) are on right. Voltage responses (Vm) are superimposed for the injected cells (thin traces) and noninjected cells (thick traces). Current pulses (I1 and I2) are displayed below their associated voltage traces. Negative currents caused strong hyperpolarizations of injected cells and smaller hyperpolarizations of noninjected cells (the latter as a result of current flowing through gap junctions). The time courses of voltage responses were faster in P14 than P1 cells. The voltage scale is 20 mV for injected cells and 2 mV for noninjected cells. B, Strong electrical coupling in a P9 animal. Release of cell 1 from a hyperpolarized potential caused a rebound burst of action potentials in cell 1, depolarizing the noninjected cell (cell 2) via electrical coupling, ultimately causing a spike. Expanded trace: note summating spikelets (arrowheads) leading to an action potential in cell 2. The 20 mV and 11 ms scale bar values apply to cell 2, expanded trace. Other scale bar values apply to main traces.
Figure 4.
Figure 4.
Properties of electrical coupling in the developing TRN. A, Incidence of electrically coupled pairs across ages was high and relatively stable. Values for each age group equal the (number of coupled pairs encountered) ÷ (total number of pairs tested). B, Coupling coefficients changed very little across age. C, There was a significant increase in junctional conductance with age (r = 0.546, p = 0.0001). In B and C, circles are values for individual cell pairs and bars are age-group means.
Figure 5.
Figure 5.
Relationships between passive membrane properties and gap junctional conductances. A, Plot of input conductance (Gin) versus gap junctional conductance. Circles are values for individual cell pairs (input conductances were averaged for the two cells within each pair). B, Plot of input capacitance (Cin) versus gap junctional conductance. There were strong correlations between gap junctional conductance and both of the membrane properties (r ≥ 0.43, p < 0.0001 for linear regression using raw values; r ≥ 0.567, p < 0.0001 using log10 transformed junctional conductances).
Figure 6.
Figure 6.
Age differences in subthreshold frequency transfer across electrical synapses. A, Examples of subthreshold responses to sinusoidal current injections for P2 (top) and P11 (bottom) TRN cell pairs. Signals (1 Hz, left) were transmitted across the electrical synapses more effectively than 16 Hz signals (right): compare ratio of postsynaptic to presynaptic voltage amplitudes (Vpost:Vpre). The high frequency attenuation in transmission is more pronounced in the P2 than the P11 cell pair. Peak-to-peak current injections: P2, 1 Hz = 25 pA; P2, 16 Hz = 90 pA; P11, 1 Hz = 180 pA; P11, 16 Hz = 280 pA. B, Plot of CC (left axis) and phase lag (right axis) at various frequencies of sinusoidal current injection for young (P1–4, n = 4) versus older (P11–14, n = 5) cell pairs. CC normalized to the 1 Hz value. Phase lag measured in degrees between the presynaptic and postsynaptic voltage responses across frequencies. The attenuation of CC with increasing frequency was more pronounced in the younger group than the older group. Phase lags increased with frequency in both groups but were uniformly longer in the young group.
Figure 7.
Figure 7.
Spikelets amplitudes are stable across development and this depends on narrowing of action potentials. A, Spikes (Presynaptic) and spikelets (postsynaptic) from representative P1 and P14 cell pairs (averages of ∼80 sweeps each). Peak spikelet amplitudes are approximately equal. Steady-state coupling coefficients were 0.13 and 0.12 for the P1 and P14 pairs, respectively. Note the much wider presynaptic action potential at P1 than P14. B, Group data plotting raw spikelet amplitudes as a function of age, indicating no significant relationship (p = 0.652, r = 0.08, linear regression, n = 35 pairs). Each data point represents one pair of cells. C, When spikelet amplitudes were normalized to presynaptic spike width (at half-amplitude, in ms), a strong correlation with age emerged (r = 0.50, p < 0.003). D, Results from model cell pairs connected by gap junctions. The presynaptic spike waveforms were the same as those in A (which are representative for their respective ages). Gap junctional conductances and postsynaptic Gin and Cin were set to average values recorded at P1 and P14 (from Figs. 2 and 4). Spikelet amplitudes were similar in the P1 and P14 model cells, and the spikelet shapes at each age were similar to those of the real spikelets shown in A. E, To test the effect of action potential shape, a common presynaptic spike waveform (the average of the P1 and P14 spikes from D) was applied in both the P1 and P14 models. Under these conditions, spikelets were much larger at P14 than at P1, indicating that narrowing of spike width normally contributes to stability of spikelet amplitudes as cells mature.
Figure 8.
Figure 8.
Spike synchrony between pairs of coupled TRN cells. A, Example P9 cell pair exhibiting spike synchrony during simultaneous steady-state current injection (80 pA). B, Action potential cross-correlogram from the cell pair in A (bin width, 11 ms). Fifteen seconds of spiking data were acquired for the plot shown here. Note the large central peak indicating strong synchrony. C, The peak of the AP correlation (measured at the peak closest to zero lag) was plotted as a function of the steady-state CC for 14 cell pairs at a variety of ages (from P1 to P14). There was strong positive relationship between CC and AP correlation (p = 0.0064; regression line shown). Junctional conductance was likewise strongly related to AP correlation (p = 0.0011; data not shown).
Figure 9.
Figure 9.
Chemical inhibitory synapses between TRN cells. A, In a pair of P7 TRN cells, presynaptic action potentials (top) resulted in hyperpolarizing IPSPs when the postsynaptic cell was maintained at a −66 mV steady-state potential (bottom left). The IPSP reversed around −86 mV (bottom right). In this cell pair, the electrical synapses were too weak to produce spikelets, so only the IPSPs were clearly visible. B, Inhibitory connection in P8 TRN cells which had a large coupling coefficient. When maintained at depolarized potentials (−66; bottom left), the postsynaptic cell responded to presynaptic action potentials (top) with fast depolarizing electrical potentials followed by slower hyperpolarizing chemical synaptic inhibitory potentials. The inhibition reversed around −90 mV (bottom right). Inhibitory synapses between TRN cell pairs were rarely seen (2.8% incidence, n = 180 possible connections) but existed as early as P4.

Similar articles

Cited by

References

    1. Agmon A, Connors BW. Thalamocortical responses of mouse somatosensory (barrel) cortex in vitro. Neuroscience. 1991;41:365–379. - PubMed
    1. Altman J, Bayer SA. Development of the rat thalamus: III. Time and site of origin and settling pattern of neurons of the reticular nucleus. J Comp Neurol. 1988;275:406–428. - PubMed
    1. Amitai Y, Gibson JR, Beierlein M, Patrick SL, Ho AM, Connors BW, Golomb D. The spatial dimensions of electrically coupled networks of interneurons in the neocortex. J Neurosci. 2002;22:4142–4152. - PMC - PubMed
    1. Arumugam H, Liu X, Colombo PJ, Corriveau RA, Belousov AB. NMDA receptors regulate developmental gap junction uncoupling via CREB signaling. Nat Neurosci. 2005;8:1720–1726. - PubMed
    1. Bennett MV. Physiology of electrotonic junctions. Ann N Y Acad Sci. 1966;137:509–539. - PubMed

Publication types

LinkOut - more resources