. 2009 Oct;297(4):C802-13.
doi: 10.1152/ajpcell.00129.2009. Epub 2009 Aug 5.

Epac increases melanoma cell migration by a heparan sulfate-related mechanism

Affiliations

Epac increases melanoma cell migration by a heparan sulfate-related mechanism

Erdene Baljinnyam et al. Am J Physiol Cell Physiol. 2009 Oct.

Abstract

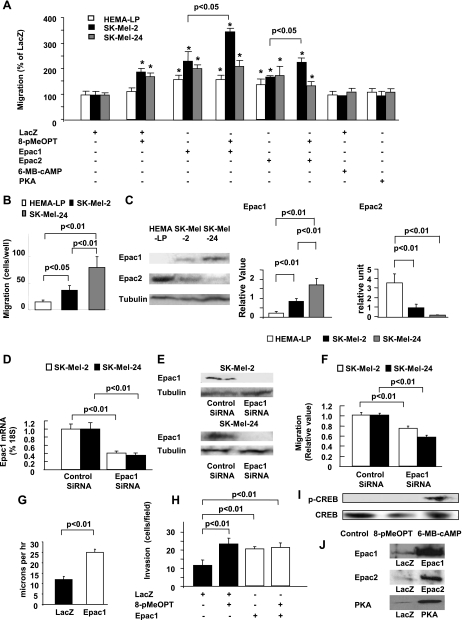
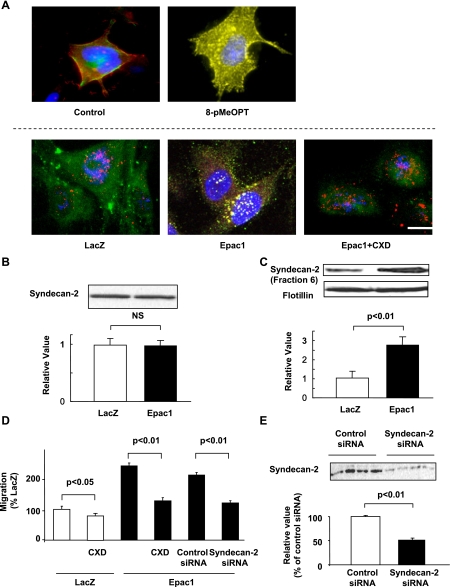
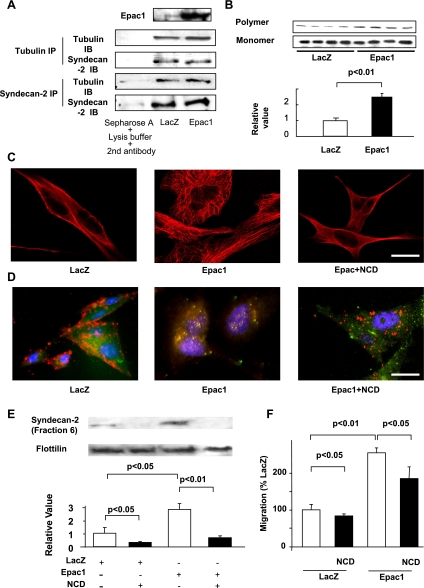
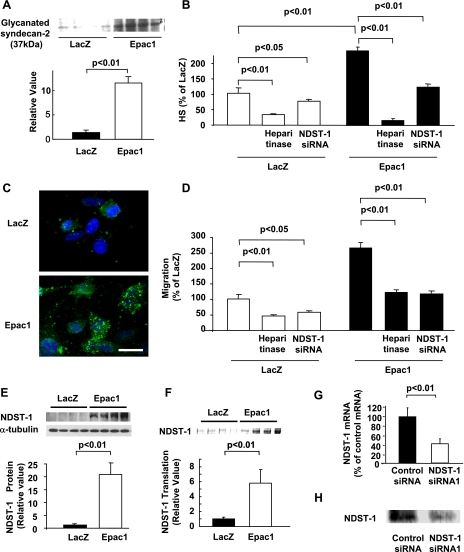
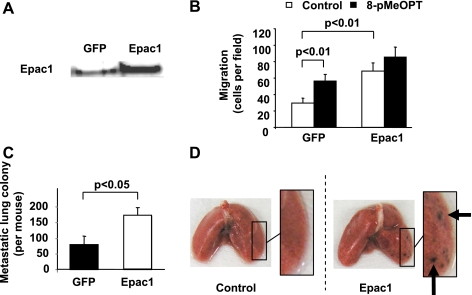
Melanoma, the most malignant form of human skin cancer, has a poor prognosis due to its strong metastatic ability. It was recently demonstrated that Epac, an effector molecule of cAMP, is involved in regulating cell migration; however, the role of Epac in melanoma cell migration remains unclear. We thus examined whether Epac regulates cell migration and metastasis of melanoma. Epac activation, by either specific agonist or overexpression of Epac, increased melanoma cell migration. Deletion of endogenous Epac with small interfering RNA decreased basal melanoma cell migration. These data suggested a major role of Epac in melanoma cell migration. Epac-induced cell migration was mediated by translocation of syndecan-2, a cell-surface heparan sulfate proteoglycan, to lipid rafts. This syndecan-2 translocation was regulated by tubulin polymerization via the Epac/phosphoinositol-3 kinase pathway. Epac-induced cell migration was also regulated by the production of heparan sulfate, a major extracellular matrix. Epac-induced heparan sulfate production was attributable to the increased expression of N-deacetylase/N-sulfotransferase-1 (NDST-1) accompanied by an increased NDST-1 translation rate. Finally, Epac overexpression enhanced lung colonization of melanoma cells in mice. Taken together, these data indicate that Epac regulates melanoma cell migration/metastasis mostly via syndecan-2 translocation and heparan sulfate production.


Figures

Fig. 1.
Fig. 1.
Epac increases melanoma cell migration. A: Epac increases melanoma cell migration. Cells were infected with adenovirus harboring LacZ, Epac1, Epac2, and protein kinase A (PKA) followed by the migration assay in the presence or absence of 50 μM 8-(4-methoxyphenylthio)-2'-O-methyladenosine-3',5'-cAMP (8-pMeOPT) or 50 μM N6-monobutyryl-cAMP (6-MB-cAMP). Both 8-pMeOPT and Epac overexpression, but neither 6-MB-cAMP nor PKA overexpression, increased melanoma cell migration. *P < 0.01 vs. LacZ. n = 4. B: basal migration assay in melanocytes and melanoma cell lines is shown. Basal migration was higher in melanoma cell lines than in melanocytes and in SK-Mel-24 cells than in SK-Mel-2 cells. n = 4. C: immunoblots for Epac1 and Epac2. Epac1 protein expression was more abundant in melanoma cell lines than in melanocytes and in SK-Mel-24 cells than in SK-Mel-2 cells. Epac2 protein expression was more abundant in melanocytes than in melanoma cell lines. Bar graphs show densitometric analyses of the blots. n = 4. D: quantitative real-time PCR (qPCR) showed that Epac1 small interfering RNA (siRNA) decreased mRNA expression in SK-Mel-2 cells or SK-Mel-24 cells are shown. n = 4. E: immunoblots showed that Epac1 siRNA decreased Epac1 protein expression in both SK-Mel-2 and SK-Mel-24 cells. F: Epac1 siRNA decreased basal cell migration in SK-Mel-2 cells or SK-Mel-24 cells. *P < 0.01 vs. control siRNA. n = 4. G: video-recorded analysis showed that SK-Mel-2 cells overexpressing Epac1 significantly increased cell motility. n = 10. Supplementary video files; video-recorded cell motility is shown. 1 second in video approximately corresponds to 1 h recording. H: invasion assay showed that both 8-pMeOPT and Epac1 overexpression increased invasion of SK-Mel-2 cells. n = 4. I: immunoblot showed that 6-MB-cAMP, but not 8-pMeOPT, increased phosphorylation of cAMP-response element-binding protein (CREB). J: immunoblot showed overexpression of Epac1, Epac2, and PKA with adenoviral infection in SK-Mel-2.
Fig. 2.
Fig. 2.
Epac activates syndecan-2 translocation into rafts in SK-Mel-2. A: immunocytochemistry for syndecan-2 (red) and FLAER (green) is shown. Top, cells were incubated in the presence or absence of 50 μM 8-pMeOPT for 15 min. 8-pMeOPT induced colocalization of syndecan-2 with lipid rafts (yellow). Bottom, cells overexpressing LacZ or Epac1 were incubated in the presence or absence of 10 μg/ml CXD. Epac1 overexpression increased colocalization of syndecan-2 with lipid rafts (yellow). CXD decreased such colocalization. B: immunoblot showed that syndecan-2 expression was not changed by Epac1 overexpression. n = 4. C: immunoblot showed that Epac1 overexpression increased syndecan-2 expression in rafts-rich fraction. Flotillin was used for a marker of lipid rafts. n = 4. D: migration assay showed that CXD (10 μg/ml) decreased basal and Epac1 overexpression-induced cell migration. Syndecan-2 siRNA also inhibited Epac1 overexpression-induced cell migration. n = 4. E: immunoblot showed decreased syndecan-2 expression with siRNA. n = 4.
Fig. 3.
Fig. 3.
Epac increases syndecan-2 translocation by tubulin polymerization in SK-Mel-2. A: immunoprecipitation showed that syndecan-2 physically interacts with tubulin; however, Epac1 overexpression did not enhance the binding between syndecan-2 and tubulin. Epac1 was increased by Epac1 overexpression (top). B: immunoblots showed that Epac1 overexpression increases polymer form of tubulin. A bar graph shows the densitometric analysis of ratios of tubulin polymers to tubulin monomers. n = 4. C: immunocytochemistry for tubulin (red) is shown. Epac1 overexpression increased fine tubulin network, and such network formation was inhibited by nocodazol (NCD, 10 μM). Scale bar, 3 μm. D: immunocytochemistry for syndecan-2 (red) and lipid rafts (green) is shown. NCD (10 μM) decreased Epac1-induced syndecan-2 colocalization with lipid rafts (yellow). Scale bar, 3 μm. E: immunoblot showed that NCD (10 μM) decreased basal and Epac overexpression-induced syndecan-2 expression in lipid rafts-rich fraction. n = 4. F: migration assay showed that NCD (10 μM) decreased basal and Epac1 overexpression-induced cell migration. n = 4.
Fig. 4.
Fig. 4.
Epac regulates tubulin polymerization via phosphoinositol-3 kinase (PI3K) in SK-Mel-2. AC: immunoblots for polymer and monomer form of tubulin (A), phosphorylated and total form of Akt (B), or GSK3β (C) are shown. Bar graphs show densitometric analysis of ratios of tubulin polymers to tubulin monomers (A) and ratios of phosphorylated form and total protein (B and C). Wortmannin (10 μM) decreased Epac1-induced tubulin polymerization, basal and Epac1 overexpression-induced phosphorylation of Akt and GSK3β. n = 4. D: immunoblot showed that wortmannin (10 μM) decreased syndecan-2 expression in lipid rafts-rich fraction in cells with either LacZ or Epac1 overexpression. n = 4. E: immunocytochemistry for syndecan-2 (red) and lipid rafts (green) is shown. Wortmannin (10 μM) decreased Epac1 overexpression-induced syndecan-2 colocalization with lipid rafts (yellow). Scale bar, 3 μm. F: migration assay was performed in the presence or absence of wortmannin (10 μM). Wortmannin inhibited basal and Epac1-induced migration n = 4.
Fig. 5.
Fig. 5.
Epac increases cell migration by heparin sulfate (HS) production in SK-Mel-2. A: immunoblot showed that Epac1 overexpression increased glycanated form of syndecan-2. n = 4. B: HS ELISA showed that amount of HS was increased by Epac1 overexpression. Both heparitinase (0.08 U/ml) and NDST-1 siRNA decreased basal and Epac1 overexpression-induced HS amount. n = 4. C: immunocytochemistry showed that HS (green) was increased in cells overexpressing Epac1. Scale bar, 3 μm. D: migration assay showed that both heparitinase (0.08 U/ml) and NDST1 siRNA decreased basal and Epac1 overexpression-induced cell migration. n = 4. E: immunoblot showed that NDST-1 expression was increased by Epac1 overexpression. n = 4. F: autoradiography of [ 35S] methionine pulse labeling assay showed that NDST-1 protein translation was increased by Epac1 overexpression. n = 4. G: qPCR showed that NDST-1 siRNA decreased mRNA expression of NDST-1. n = 4. H: immunoblot showed that NDST-1 siRNA decreased protein expression of NDST-1.
Fig. 6.
Fig. 6.
Epac increases lung metastasis of Cloudman S91 melanoma in mice. A: immunoblot showed that Epac1 is endogenously expressed in S91 cells (left lane) and Epac1 adenovirus infection further increased Epac1 expression (right lane). B: migration assay showed that both 8-pMeOPT (50 μM) and Epac1 overexpression increased cell migration. n = 4. C: lung colonization assay demonsrated that the number of metastatic colonies was increased by Epac1 overexpression compared with control (GFP). n = 10. D: representative pictures of lungs from mice subjected to the melanoma cell injection are shown. Metastatic nodules on the lung surface are indicated by arrows.

Comment in

References

    1. Araki E, Momota Y, Togo T, Tanioka M, Hozumi K, Nomizu M, Miyachi Y, Utani A. Clustering of Syndecan-4 and integrin β1 by iaminin α3 chain-derived peptide promotes keratinocyte migration. Mol Biol Cell 20: 3012–3024, 2009 - PMC - PubMed
    1. Bellahcene A, Castronovo V, Ogbureke KU, Fisher LW, Fedarko NS. Small integrin-binding ligand N-linked glycoproteins (SIBLINGs): multifunctional proteins in cancer. Nat Rev Cancer 8: 212–226, 2008 - PMC - PubMed
    1. Benoist F and Grand-Perret T. Cotranslational degradation of apolipoprotein B100 by the proteasome is prevented by microsomal triglyceride transfer protein synchronized translation studies on HepG2 cells treated with an inhibitor of microsomal triglyceride transfer protein. J Biol Chem 272: 20435–20442, 1997 - PubMed
    1. Bernfield M, Gotte M, Park PW, Reizes O, Fitzgerald ML, Lincecum J, Zako M. Functions of cell surface heparan sulfate proteoglycans. Ann Rev Biochem 68: 729–777, 1999 - PubMed
    1. Berwick M, Wiggins C. The current epidemiology of cutaneous malignant melanoma. Front Biosci 11: 1244–1254, 2006 - PubMed

Publication types

MeSH terms