. 2009 Oct 2;284(40):27438-48.
doi: 10.1074/jbc.M109.023572. Epub 2009 Aug 5.

Increased lipid oxidation causes oxidative stress, increased peroxisome proliferator-activated receptor-gamma expression, and diminished pro-osteogenic Wnt signaling in the skeleton

Affiliations

Increased lipid oxidation causes oxidative stress, increased peroxisome proliferator-activated receptor-gamma expression, and diminished pro-osteogenic Wnt signaling in the skeleton

Maria Almeida et al. J Biol Chem. .

Abstract

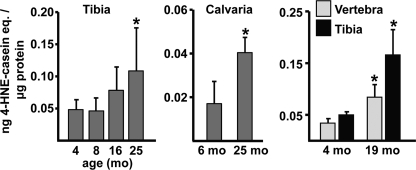
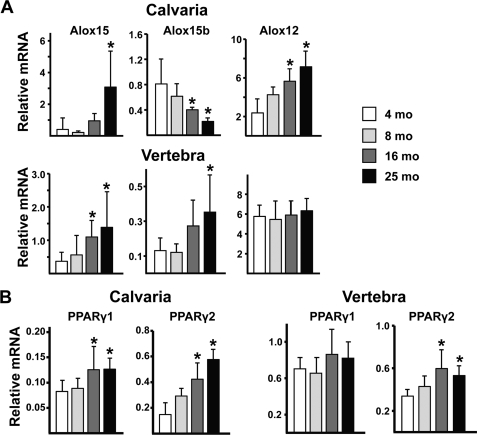
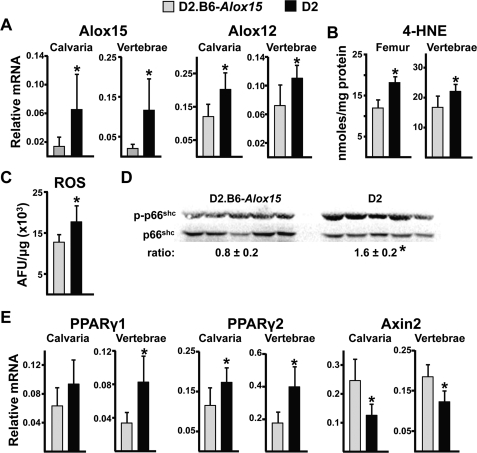
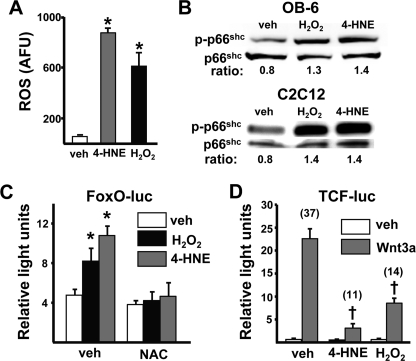
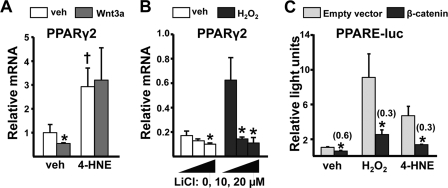
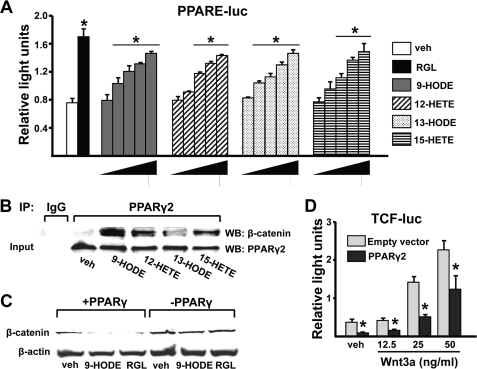
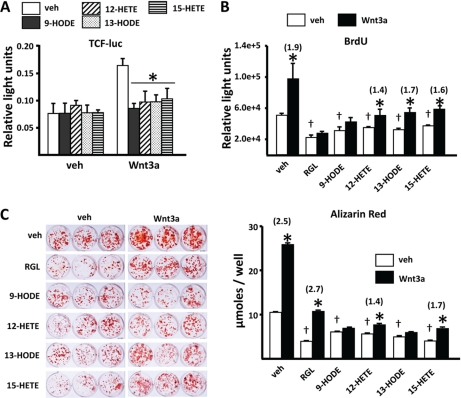
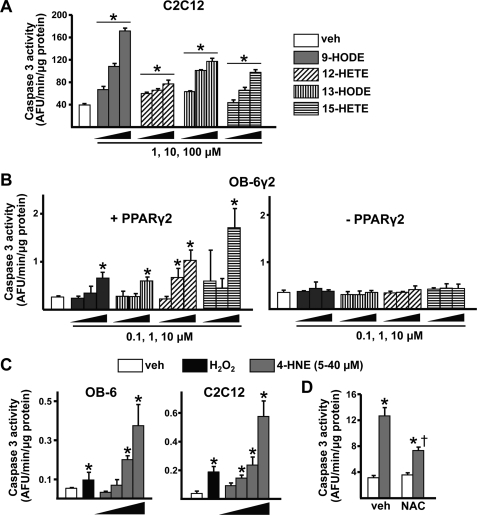
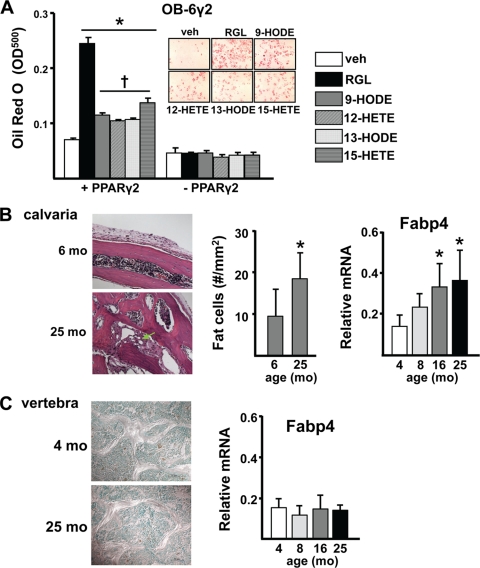
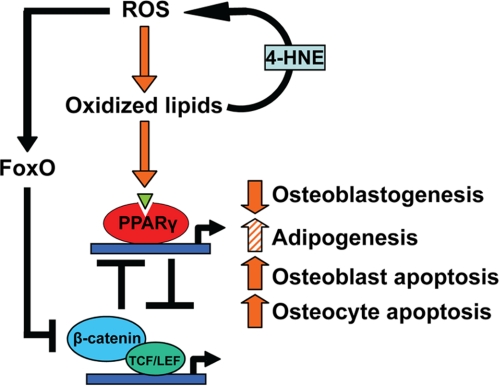
Loss of bone mass with advancing age in mice is because of decreased osteoblast number and is associated with increased oxidative stress and decreased canonical Wnt signaling. However, the underlying mechanisms are poorly understood. We report an age-related increase in the lipid oxidation product 4-hydroxynonenal (4-HNE) as well as increased expression of lipoxygenase and peroxisome proliferator-activated receptor-gamma (PPARgamma) in the murine skeleton. These changes together with decreased Wnt signaling are reproduced in 4-month-old mice bearing a high expressing allele of the lipoxygenase Alox15. The addition of 4-HNE to cultured osteoblastic cells increases oxidative stress, which in turn diverts beta-catenin from T-cell-specific transcription factors to Forkhead box O (FoxO) transcription factors, thereby attenuating the suppressive effect of beta-catenin on PPARgamma gene expression. Oxidized lipids, acting as ligands of PPARgamma, promote binding of PPARgamma2 to beta-catenin and reduce the levels of the latter, and they attenuate Wnt3a-stimulated proliferation and osteoblast differentiation. Furthermore, oxidized lipids and 4-HNE stimulate apoptosis of osteoblastic cells. In view of the role of oxidized lipids in atherogenesis, the adverse effects of lipoxygenase-mediated lipid oxidation on the differentiation and survival of osteoblasts may provide a mechanistic explanation for the link between atherosclerosis and osteoporosis.


Figures

FIGURE 1.
FIGURE 1.
Age-related increase in lipid oxidation in bone of B6 mice. 4-HNE adducts in bone extracts from B6 female mice from three separate experiments were measured by enzyme-linked immunosorbent assay (n = 5–8/group). *, p < 0.05 versus 4 or 6 month.
FIGURE 2.
FIGURE 2.
Age-related increase in lipoxygenase expression in bone of B6 mice. Expression levels of lipoxygenases (A) and PPARγ1 and PPARγ2 (B) by quantitative PCR in calvaria and vertebrae (L5) of B6 female mice from the experiment are shown in the left panel of Fig. 1 (n = 5–9/group). Data shown are normalized to expression of ribosomal protein S2. Essentially identical results were obtained when calvaria transcripts were normalized to glyceraldehyde-3-phosphate dehydrogenase (supplemental Fig. S2). *, p < 0.05 versus 4 month.
FIGURE 3.
FIGURE 3.
Increased Alox15 expression raises the level of oxidative stress, increases PPARγ expression, and decreases Axin2 expression in bone. Shown are Alox transcripts (A), 4-HNE adducts (B), ROS in the bone marrow (C), and phosphorylated p66shc (D) levels in vertebral extracts (each lane represents one animal) and PPARγ1, PPARγ2, and Axin2 transcripts from 4 month-old D2.B6-Alox15 or D2 mice (n = 6/group) (E). Combined data from male and female mice are presented because there was no effect of gender on the indices examined. *, p < 0.05 versus D2.B6-Alox15.
FIGURE 4.
FIGURE 4.
4-HNE-induced oxidative stress stimulates FoxO-mediated transcription and decreases β-catenin/TCF-mediated transcription in C2C12 and osteoblastic OB-6 cells. A, ROS levels in OB-6 cells incubated with vehicle (PBS), 4-HNE (20 μm), or H2O2 (100 μm) for 15 min. AFU, arbitrary fluorescence units. B, phosphorylated p66shc levels by Western blot analysis in OB-6 or C2C12 cells incubated with vehicle, H2O2 (100 μm), or 4-HNE (20 μm) for 1 h. The ratio of phosphorylated to total protein is depicted numerically in the bottom of each lane. C, luciferase activity in C2C12 cells transfected with the FoxO-luc reporter construct after pretreatment with vehicle (PBS) or NAC (10 mm) for 1 h then with vehicle, H2O2 (50 μm), or 4-HNE (20 μm) for 24 h. D, luciferase activity in C2C12 cells transfected with a TCF-luc reporter construct after pretreatment with vehicle, 4-HNE, or H2O2, as in B, then with vehicle or Wnt3a (50 ng/ml) for 24 h. Bars represent the mean ± S.D. of triplicate determinations. Numbers in parentheses represent -fold change versus respective vehicle control. *, p < 0.05 versus vehicle; †, p < 0.05 versus Wnt3a alone.
FIGURE 5.
FIGURE 5.
4-HNE or H2O2 increase PPARγ2 expression in C2C12 cells. PPARγ2 gene expression by quantitative PCR in C2C12 cells pretreated with vehicle (PBS), 4-HNE (20 μm), or H2O2 (100 μm) for 1 h followed by vehicle or Wnt3a (50 ng/ml) for 5 h (A) or in cells pretreated with vehicle or H2O2 as above followed by vehicle or indicated concentration of LiCl for 5 h (B). C, luciferase activity in C2C12 cells transfected with a PPARE-luc reporter construct and co-transfected with either an empty vector (pcDNA) or a constitutively active β-catenin mutant. Cells were then treated with vehicle, 4-HNE, or H2O2 as in A for 24 h. Bars represent the mean ± S.D. of triplicate determinations. Numbers in parentheses represent -fold change versus respective vehicle control. *, p < 0.05 versus respective vehicle control (A and B) or empty vector control (C). †, p < 0.05 versus cells given neither 4-HNE nor Wnt3a.
FIGURE 6.
FIGURE 6.
Peroxidized PUFAs promote PPARγ-mediated transcription and binding of PPARγ to β-catenin and suppress β-catenin/TCF-mediated transcription. A, luciferase activity in C2C12 cells transfected with a PPARE-luc reporter construct and treated with vehicle (3.3% BSA in PBS), RGL (5 μm), or the indicated peroxidized PUFAs (3, 10, 30, 60, 100 μm) for 24 h. Bars represent the mean ± S.D. of triplicate determinations. *, p < 0.05 versus vehicle by ANOVA. B, C2C12 cells were incubated with vehicle or the indicated peroxidized PUFAs (10 μm) for 1 h. Cell lysates were immunoprecipitated (IP) with protein A-Sepharose in combination with the non-immune IgG or an anti-PPARγ2 antibody. Immunoprecipitates were analyzed by Western blotting (WB) using anti-β-catenin or anti-PPARγ2 antibodies. C, β-catenin protein levels by Western blotting of OB-6γ2 cell extracts. Cells were cultured as described under “Experimental Procedures” to induce or repress PPARγ2 gene expression and then incubated with vehicle, 9-HODE (10 μm), or RGL (5 μm) for 4 h. D, luciferase activity in C2C12 cells transfected with a TCF-luc reporter construct and co-transfected with either an empty vector (pcDNA) or a PPARγ2 expression construct followed by treatment with vehicle (PBS) or Wnt3a for 24 h. Bars represent the mean ± S.D. of triplicate determinations. *, p < 0.05 versus respective empty vector control.
FIGURE 7.
FIGURE 7.
Peroxidized PUFAs prevent Wnt3a-induced transcription, proliferation, and osteoblastogenesis. A, luciferase activity in C2C12 cells transfected with a TCF-luc reporter construct. Cells were pretreated with vehicle (3.3% BSA in PBS) or the indicated peroxidized PUFAs (100 μm) for 1 h, then with Wnt3a (10 ng/ml) for 24 h. B, proliferation of C2C12 cells, determined by bromodeoxyuridine (BrdU) incorporation. Cells were pretreated with vehicle, RGL (5 nm), or the indicated peroxidized PUFAs (10 μm) for 1 h followed by Wnt3a (25 ng/ml) for 3 days. C, mineralized matrix visualized and quantified by alizarin red staining. Cultures of femoral bone marrow cells were established as described under “Experimental Procedures,” then incubated with RGL (1 nm) or the indicated peroxidized PUFAs (100 μm) without or with Wnt3a (25 ng/ml) for 18 days. Mineralized matrix was visualized by staining with alizarin red (left panel) and quantified after extraction (right panel). Bars represent the mean ± S.D. of triplicate determinations. Numbers in parentheses represent -fold change versus respective vehicle control. *, p < 0.05 versus respective vehicle control. †, p < 0.05 versus cells given neither PPARγ ligands nor Wnt3a.
FIGURE 8.
FIGURE 8.
Oxidized PUFAs and 4-HNE promote apoptosis of osteoblastic cells. A and B, caspase-3 activity in cells incubated with vehicle (3.3% BSA in PBS) or the indicated concentrations of peroxidized PUFAs for 6 h. A, C2C12 cells. B, OB-6γ2 cells were cultured as described under “Experimental Procedures” to induce or repress PPARγ2 gene expression. C and D, caspase-3 activity in OB-6 or C2C12 cells incubated with H2O2 (50 μm) or 5, 10, 20. or 40 μm 4-HNE for 6 h (C) or C2C12 cells pretreated for 1 h with NAC (10 mm) followed by 4-HNE (20 μm) for 6 h (D). Bars represent the mean ± S.D. of triplicate determinations. *, p < 0.05 versus vehicle control. †, p < 0.05 versus cells treated with 4-HNE alone.
FIGURE 9.
FIGURE 9.
Adipogenesis is not an inevitable accompaniment of increased lipid oxidation. A, OB-6γ2 cells were cultured to induce or repress PPARγ2 gene expression and then treated with vehicle (PBS), RGL (1 nm), or the indicated oxidized PUFAs (100 μm) for 8 days. Lipid was visualized with Oil Red O (inset, PPARγ2-expressing cells) and quantified as described under “Experimental Procedures.” *, p < 0.05 versus vehicle control. †, p < 0.05 versus RGL by ANOVA. B, adipocytes (arrow, left panel) in calvaria bone of B6 mice were quantified by histomorphometry (middle panel) of hematoxylin- and eosin-stained decalcified sections. Quantification of the adipocyte marker Fabp4 was done by quantitative PCR after normalization to glyceraldehyde-3-phosphate dehydrogenase in a separate experiment (right panel). C, adipocytes in toluidine blue-stained nondecalcified sections (left panel) and Fabp4 expression (right panel) number was determined in vertebral bone as in B. Bars represent the means ± S.D.; *, p < 0.05 versus 4 or 6 months.
FIGURE 10.
FIGURE 10.
Suppression of β-catenin by an oxidized lipid-activated ROS/FoxO/PPARγ/β-catenin cascade, leading to decreased bone formation. Oxidized PUFAs generated by ROS and lipoxygenases increase the oxidative burden of the skeleton via the generation of 4-HNE. Oxidative stress activates the FoxO family of transcription factors, which in turn attenuate β-catenin/TCF-mediated transcription, leading to derepression of PPARγ transcription. Oxidized PUFAs activate PPARγ and promote association with β-catenin, resulting in a further decrease in β-catenin. Via this cascade, lipid oxidation contributes to the decline in osteoblast number and bone formation that occurs with aging by attenuating the canonical Wnt signaling required for the differentiation and survival of osteoblasts. However, PPARγ-mediated diversion of progenitors from the osteoblast to the adipocyte lineage may or may not occur depending on the skeletal site. LEF, lymphoid enhancer-binding factor.

References

    1. Lips P., Courpron P., Meunier P. J. (1978) Calcif. Tissue Res. 26, 13–17 - PubMed
    1. Parfitt A. M. (1990) in Bone: Volume 1. The Osteoblast and Osteocyte (Hall B. K. ed) pp. 351–429, Telford Press and CRC Press, Boca Raton, FL
    1. Tyner S. D., Venkatachalam S., Choi J., Jones S., Ghebranious N., Igelmann H., Lu X., Soron G., Cooper B., Brayton C., Hee Park S., Thompson T., Karsenty G., Bradley A., Donehower L. A. (2002) Nature 415, 45–53 - PubMed
    1. Jilka R. L. (2002) BoneKey-Osteovision 10.1138/2002024 - DOI
    1. Ali A. A., Weinstein R. S., Stewart S. A., Parfitt A. M., Manolagas S. C., Jilka R. L. (2005) Endocrinology 146, 1226–1235 - PubMed

Publication types

MeSH terms