Review
. 2009 Nov;23(11):1941-56.
doi: 10.1038/leu.2009.160. Epub 2009 Aug 6.

The molecular characterization and clinical management of multiple myeloma in the post-genome era

Affiliations
Review

The molecular characterization and clinical management of multiple myeloma in the post-genome era

Y Zhou et al. Leukemia. 2009 Nov.

Abstract

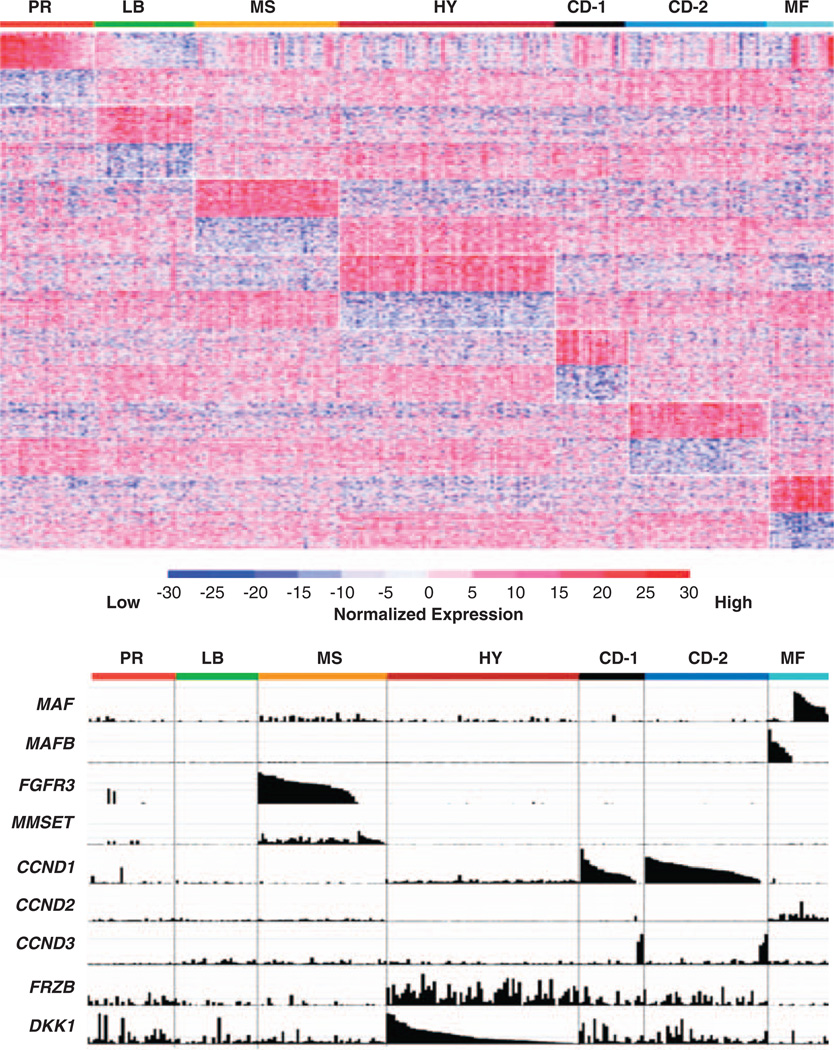
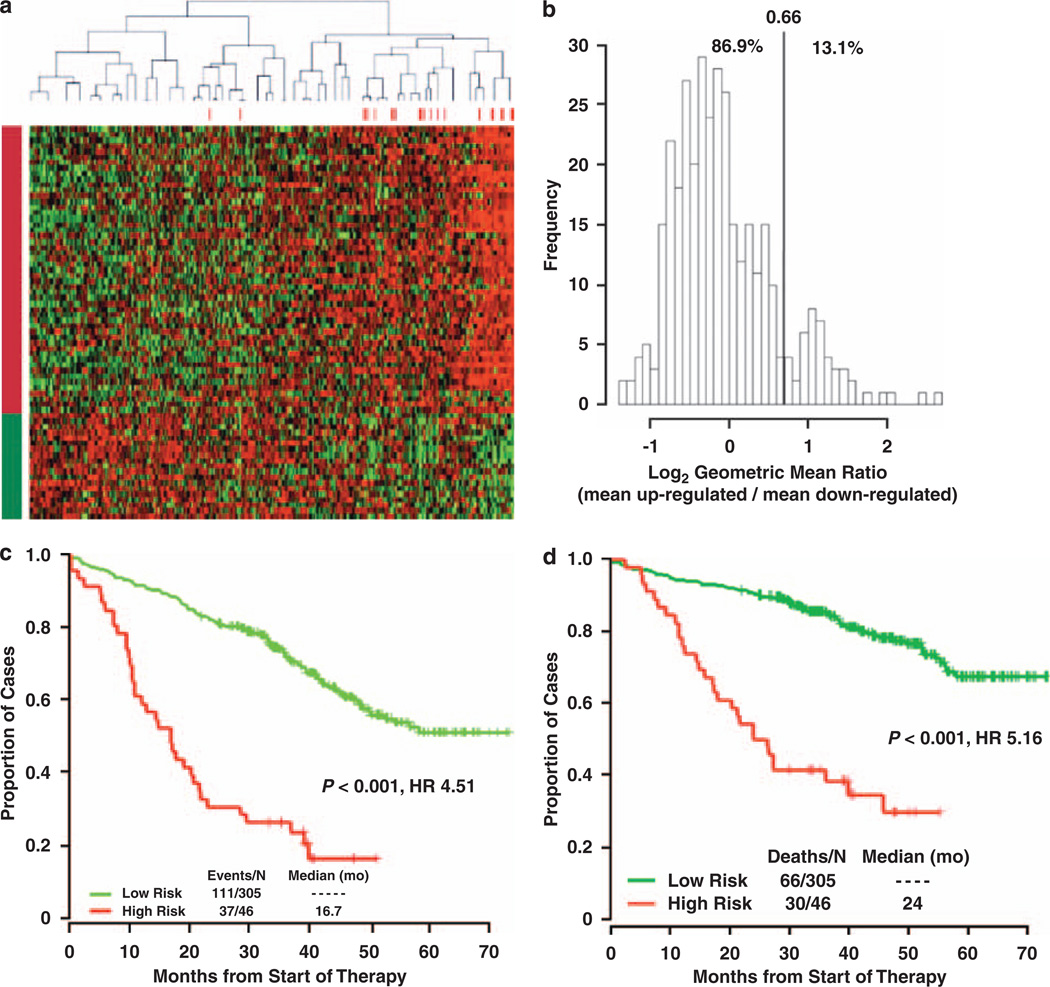
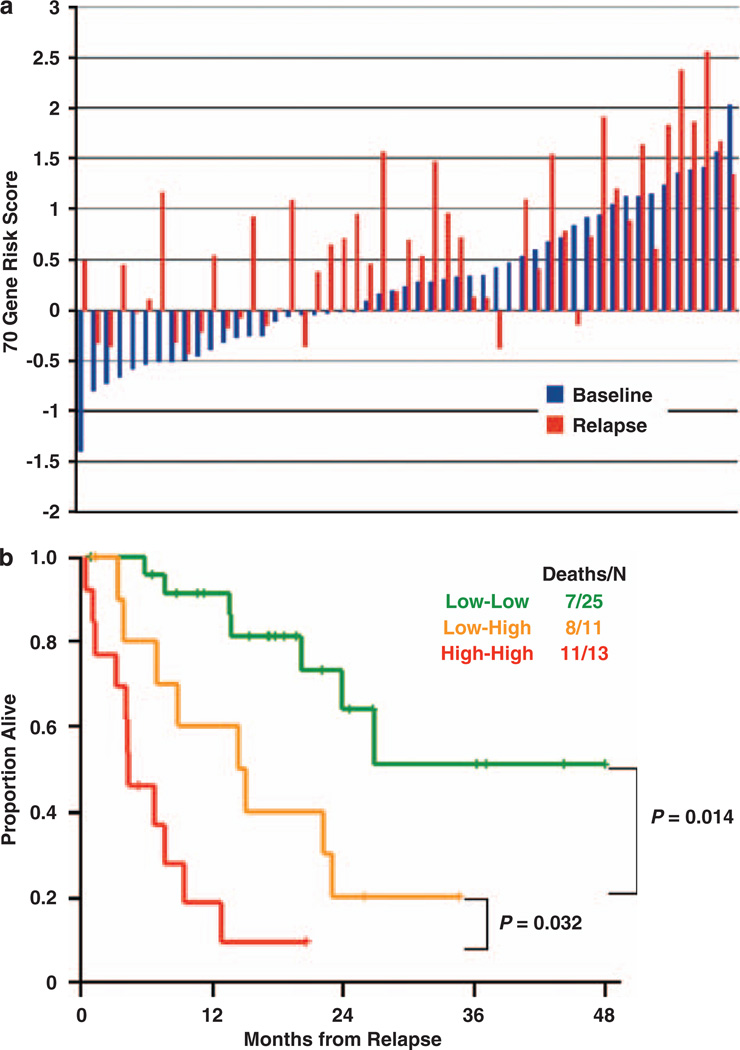
Cancer-causing mutations disrupt coordinated, precise programs of gene expression that govern cell growth and differentiation. Microarray-based gene-expression profiling (GEP) is a powerful tool to globally analyze these changes to study cancer biology and clinical behavior. Despite overwhelming genomic chaos in multiple myeloma (MM), expression patterns within tumor samples are remarkably stable and reproducible. Unique expression patterns associated with recurrent chromosomal translocations and ploidy changes defined molecular classes with differing clinical features and outcomes. Combined molecular techniques also dissected two distinct, reproducible forms of hyperdiploid disease and have molecularly defined MM with high risk for poor clinical outcome. GEP is now used to risk-stratify patients with newly diagnosed MM. Groups with high-risk features are evident in all GEP-defined MM classes, and GEP studies of serial samples showed that risk increases over time, with relapsed disease showing dramatic GEP shifts toward a signature of poor outcomes. This suggests a common mechanism of disease evolution and potentially reflects preferential expansion of therapy-resistant cells. Correlating GEP-defined disease class and risk with outcomes of therapeutic regimens reveals class-specific benefits for individual agents, as well as mechanistic insights into drug sensitivity and resistance. Here, we review modern genomics contributions to understanding MM pathogenesis, prognosis, and therapy.


Conflict of interest statement

Conflict of interest

The authors declare no conflict of interest.

Figures

Figure 1
Figure 1
Classes are characterized by unique GEP patterns. (upper panel) A supervised clustergram of the expression of 700 genes (50 SAM-defined overexpressed and 50 underexpressed genes from each of the 7 classes) across 256 newly diagnosed cases. Genes are indicated along the vertical axis and samples on the horizontal axis. The normalized expression value for each gene is indicated by a color, with red representing high expression and blue representing low expression. (lower panel) The Affymetrix gene-expression signal (expression level: vertical axis) for the mRNA of MAF MAFB, FGFR3, MMSET, CCND1, CCND2, CCND3, FRZB, and DKK1, within classes presented in the upper panel, are indicated. The normalized expression level for each gene across the samples is given by the height of each bar. Note that spiked expression of CCND1, MAF and MAFB, and FGFR3 and MMSET is strongly correlated with specific subgroup designations. Also note that cases retaining the MMSET spike, but lacking FGFR3 spikes maintain similar cluster designation, and MAF and MAFB spikes cluster in the same subgroups. Several MMSET and CCND1 spikes cases are evident in the PR class. CCND3 expression is mutually exclusive of CCND1 expression. Although overexpressed in the HY subgroup, FRZB and DKK1 are significantly underexpressed in LB and MF. Figures reproduced with permission from Blood.
Figure 2
Figure 2
A GEP-based 70-gene score can define high-risk myeloma. (a) Heat map of the 70 genes illustrate remarkably similar expression patterns in CD138+ selected tumor cells among 351 newly diagnosed patients. Red bars above the patient columns denote patients with disease-related deaths at the time of analysis. The 51 genes in rows designated by the red bar on the left (top rows; upregulated) identified patients in the upper quartile of expression at high risk for early disease-related death. The 19 gene rows designated by the green bar (downregulated), identified patients in the lower quartile of expression at high risk of early disease-related death. (b) Frequencies of the risk score defined as the log2 geometric mean ratio of the 51 quartile 4 genes and 19 quartile 1 genes. This self-normalizing expression ratio has a marked bimodal distribution, consistent with the upper/lower quartile log-rank differential expression analysis, which was designed to detect genes that define a single high-risk group (13.1%) with an extreme expression distribution. Interpreted as an up/downregulation ratio on the log2-scale, higher values are associated with poor outcome. The vertical line shows the high-risk versus low-risk cutoff for the log2-scale ratio determined by K-means clustering: the percentage of samples below and above the cutoff is also shown. Kaplan–Meier estimates of EFS (c) and OS (d) in low-risk myeloma (green) and high-risk myeloma (red) showed inferior 5-year actuarial probabilities of EFS (18% versus 60%, P<0.001; HR = 4.51) and OS (28% versus 78%, P <0.001; HR=5.16) in the 13.1% patients with a high-risk signature. Reproduced with Permission from Blood.
Figure 3
Figure 3
70-gene risk score can increase in relapsed relative to newly diagnosed disease and an increase predicts poor post-relapse survival. (a) The 70-gene risk score in paired diagnostic (blue) and relapse (red) samples of 51 patients. The gene expression risk score is indicated to the left. Sample pairs are order from left to right based on lowest baseline score. (b) Kaplan–Meier plot of post-relapse survival of the three groups defined by low risk both at diagnosis and relapse (low-low), low risk at diagnosis and high risk at relapse (low-high), and high risk at both time points (high-high). Reproduced with Permission from Blood.

References

    1. Barlogie B, Shaughnessy J, Epstein J, Sanderson R, Anaissie E, Walker R, et al. Plasma cell myeloma. In: Lichtman MA, Beutler E, Kaushansky K, Kipps TJ, Seligsohn U, Prchal J, editors. Williams Hematology. 7 edn. New York: McGraw-Hill Professional; 2005. pp. 1501–1533.
    1. Ribatti D, Nico B, Vacca A. Importance of the bone marrow microenvironment in inducing the angiogenic response in multiple myeloma. Oncogene. 2006;25:4257–4266. - PubMed
    1. Alizadeh AA, Eisen MB, Davis RE, Ma C, Lossos IS, Rosenwald A, et al. Distinct types of diffuse large B-cell lymphoma identified by gene expression profiling. Nature. 2000;403:503–511. - PubMed
    1. Shipp MA, Ross KN, Tamayo P, Weng AP, Kutok JL, Aguiar RC, et al. Diffuse large B-cell lymphoma outcome prediction by gene-expression profiling and supervised machine learning. Nat Med. 2002;8:68–74. - PubMed
    1. Rosenwald A, Wright G, Wiestner A, Chan WC, Connors JM, Campo E, et al. The proliferation gene expression signature is a quantitative integrator of oncogenic events that predicts survival in mantle cell lymphoma. Cancer Cell. 2003;3:185–197. - PubMed

Publication types