

Genetic polymorphisms of EPHX1, Gsk3beta, TNFSF8 and myeloma cell DKK-1 expression linked to bone disease in myeloma
- PMID: 19657367
- PMCID: PMC3684359
- DOI: 10.1038/leu.2009.129
Genetic polymorphisms of EPHX1, Gsk3beta, TNFSF8 and myeloma cell DKK-1 expression linked to bone disease in myeloma
Abstract
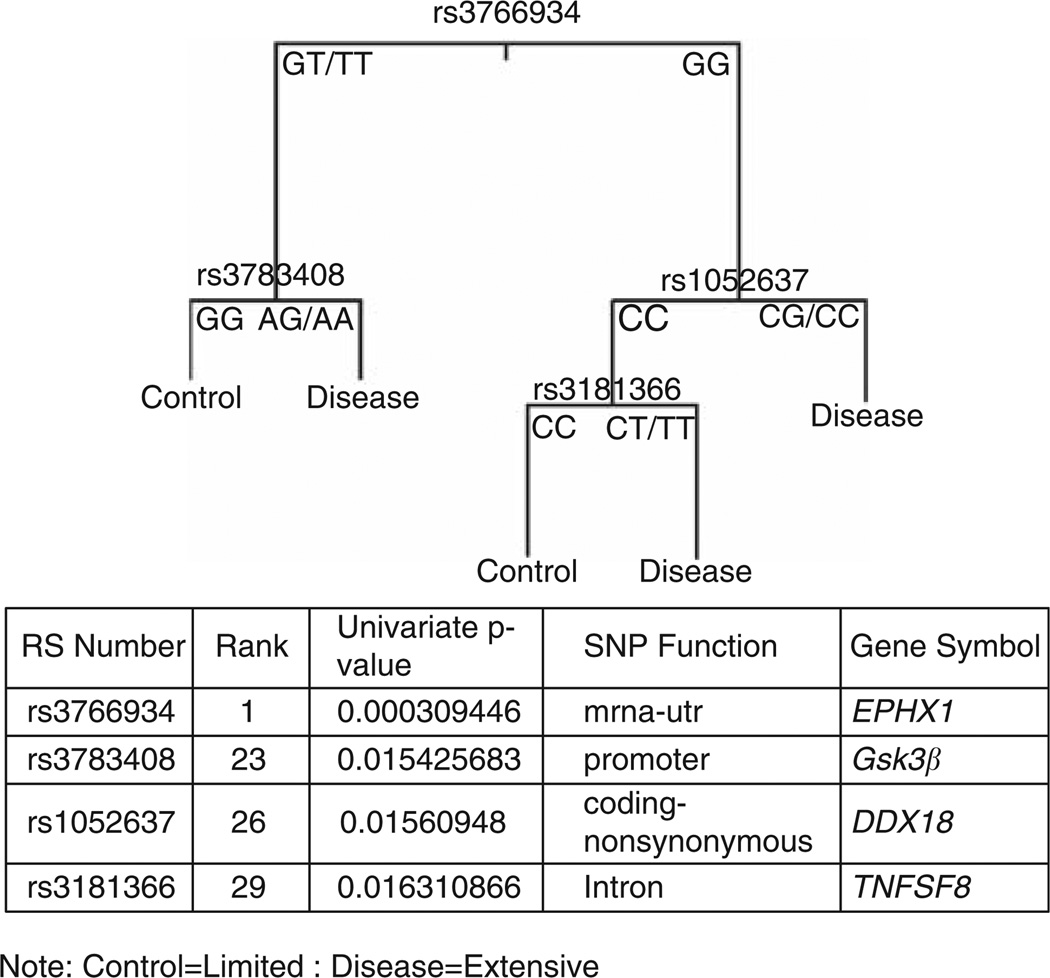
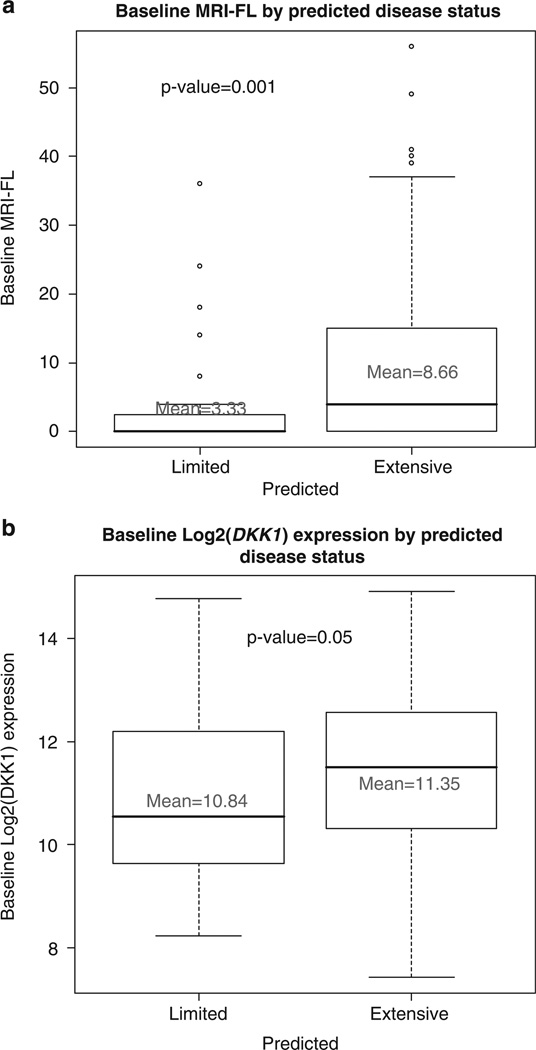
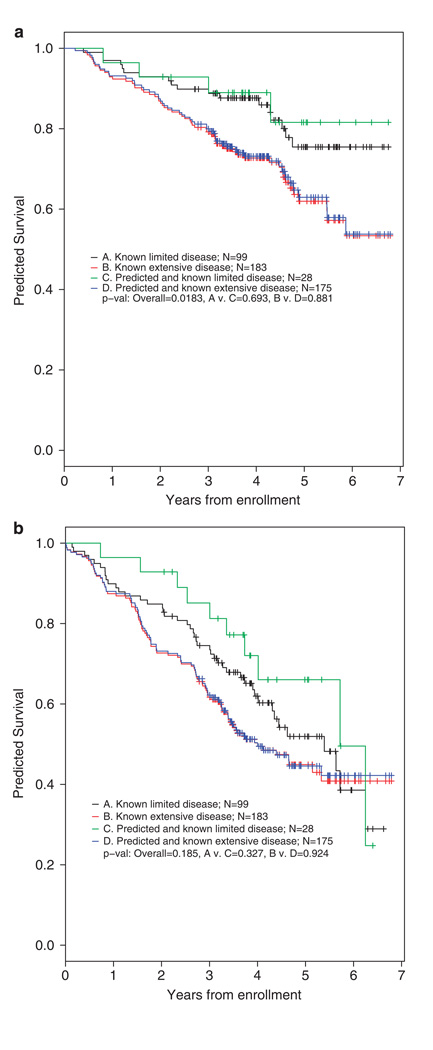
Bone disease in myeloma occurs as a result of complex interactions between myeloma cells and the bone marrow microenvironment. A custom-built DNA single nucleotide polymorphism (SNP) chip containing 3404 SNPs was used to test genomic DNA from myeloma patients classified by the extent of bone disease. Correlations identified with a Total Therapy 2 (TT2) (Arkansas) data set were validated with Eastern Cooperative Oncology Group (ECOG) and Southwest Oncology Group (SWOG) data sets. Univariate correlates with bone disease included: EPHX1, IGF1R, IL-4 and Gsk3beta. SNP signatures were linked to the number of bone lesions, log(2) DKK-1 myeloma cell expression levels and patient survival. Using stepwise multivariate regression analysis, the following SNPs: EPHX1 (P=0.0026); log(2) DKK-1 expression (P=0.0046); serum lactic dehydrogenase (LDH) (P=0.0074); Gsk3beta (P=0.02) and TNFSF8 (P=0.04) were linked to bone disease. This assessment of genetic polymorphisms identifies SNPs with both potential biological relevance and utility in prognostic models of myeloma bone disease.
Conflict of interest statement
The authors declare no conflict of interest.
Figures
References
-
- Hideshima T, Mitsiades C, Tonon G, Richardson PG, Anderson KC. Understanding multiple myeloma pathogenesis in the bone marrow to identify new therapeutic targets. Nat Rev Cancer. 2007;7:585–598. - PubMed
-
- Giuliani N, Rizzoli V, Roodman GD. Multiple myeloma bone disease: pathophysiology of osteoblast inhibition. Blood. 2006;108:3992–3996. - PubMed
-
- Durie BGM, Salmon SE, Mundy GR. Relation of osteoclast activating factor production to extent of bone disease in multiple myeloma. Br J Hematol. 1981;47:21–30. - PubMed
-
- Harada S, Rodan G. Control of osteoblast function and regulation of bone mass. Nature. 2003;423:349–355. - PubMed
-
- Westendorf JJ, Kahler RA, Schroeder TM. Wnt signaling in osteoblasts and bone diseases. Gene. 2004;341:19–39. - PubMed
Publication types
MeSH terms
Substances
Grants and funding
LinkOut - more resources
Full Text Sources
Other Literature Sources
Medical
Miscellaneous
