. 2009 Jun;79(6 Pt 1):061922.
doi: 10.1103/PhysRevE.79.061922. Epub 2009 Jun 23.

Ising-like dynamics in large-scale functional brain networks

Affiliations

Ising-like dynamics in large-scale functional brain networks

Daniel Fraiman et al. Phys Rev E Stat Nonlin Soft Matter Phys. 2009 Jun.

Abstract

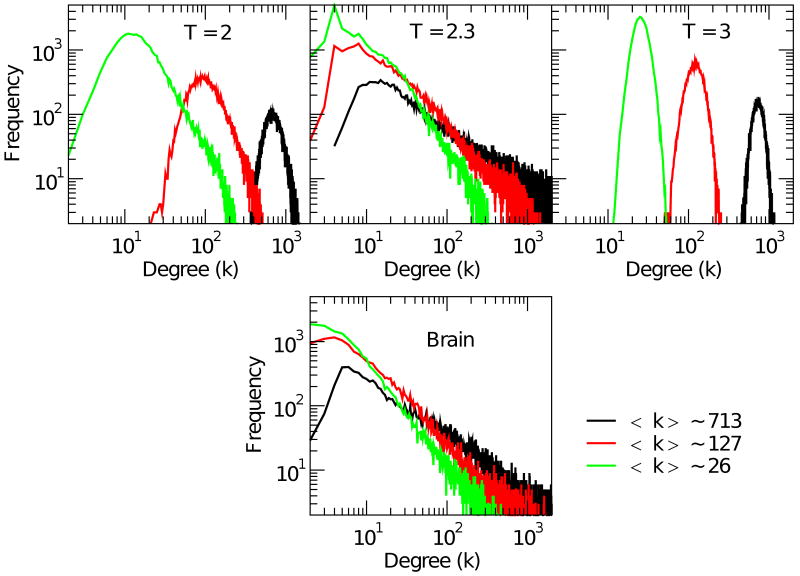
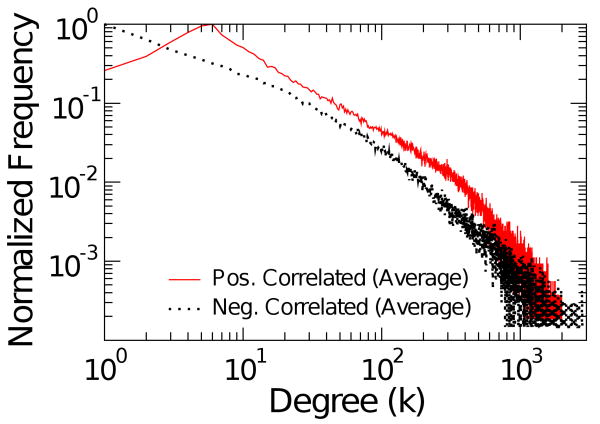
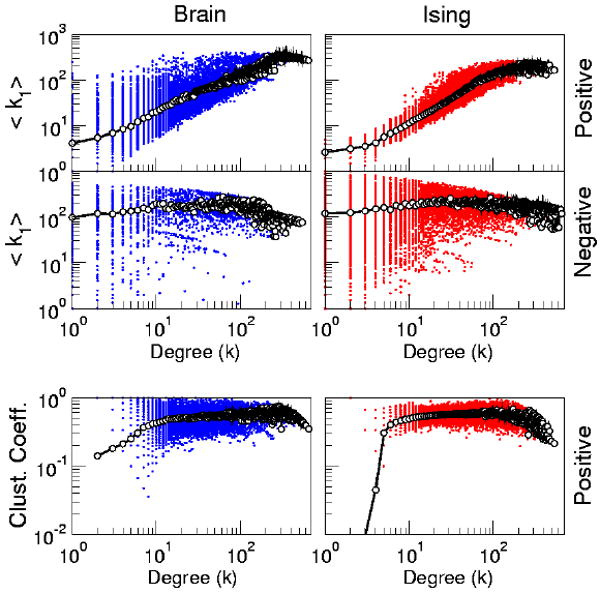
Brain "rest" is defined--more or less unsuccessfully--as the state in which there is no explicit brain input or output. This work focuses on the question of whether such state can be comparable to any known dynamical state. For that purpose, correlation networks from human brain functional magnetic resonance imaging are contrasted with correlation networks extracted from numerical simulations of the Ising model in two dimensions at different temperatures. For the critical temperature Tc, striking similarities appear in the most relevant statistical properties, making the two networks indistinguishable from each other. These results are interpreted here as lending support to the conjecture that the dynamics of the functioning brain is near a critical point.


Figures

FIG. 1
FIG. 1
(Color online) Panel (a): Brain's fMRI correlation density distribution for each of the five control subjects recorded under resting conditions. Panel (b) Ising model correlation density distribution for T = 2 (green, dashed line), T = 2.3 (red, continuos line), and T = 3 (black, dot dashed line). Insets in both panels show the log-linear plot of the same density distributions.
FIG. 2
FIG. 2
(Color online) Average degree, 〈k〉, as a function of threshold ρ for positive (a) and negative (c) correlation networks. Variance of degree, σk2, as a function of 〈K〉 for positively (b) and negatively (d) correlated networks. The dashed black line (in panels b and d), corresponds to the expected behavior of a Poisson distribution. In all graphs the Ising model data at three temperatures T = 2, T = 2.3, and T = 3 is presented, as well as the data from the five subject's fMRI brain networks.
FIG. 3
FIG. 3
(Color online) Normalized network clustering (Panel a) and path length (Panel b) as a function of average degree. Solid lines denote results for the Ising model at Tc and dashed lines the results for the brain.
FIG. 4
FIG. 4
(Color) Degree distribution for positively correlated networks. Top three panels depict the degree distribution for the Ising networks at T = 2, T = 2.3 and T = 3 for three representative values of 〈k〉 ≈ 26, 127, and 713. Bottom panel: Degree distribution for positively correlated brain network for the same three values of 〈k〉.
FIG. 5
FIG. 5
(Color) Degree distribution for negatively correlated networks. Top three panels depict the degree distribution for the Ising networks at T = 2, T = 2.3, T = 3 respectively for two representative values of 〈k〉 ≈ 49,127 and 277. Bottom panel: Degree distribution for negatively correlated brain network for the same three values of 〈k〉.
FIG. 6
FIG. 6
(Color online) Brain network's average degree distribution computed from five volunteers for 〈k〉 ≈ 127.
FIG. 7
FIG. 7
(Color online) Top four panels: Neighbor Degrees Correlation. Plot of the nearest neighbor degree, 〈k1〉, as a function of own degree k for the two type of networks extracted from the brain (left) and from the Ising model at Tc (right). Bottom panels: Clustering, C, as a function of the degree k for positively correlated networks extracted from the brain (left) and from the Ising model at Tc: In all plots dots represent individual nodes, and empty circles joined by lines represent averages. Positively correlated networks correspond to 〈k〉 ≈ 26 and negatively correlated network correspond to 〈k〉 ≈ 49.
FIG. 8
FIG. 8
(Color online) Typical brain (top) and Ising (bottom) correlation profiles. Correlations (i.e., Eq. 2.) are computed between the site with the largest degree and the rest of the time series and plotted at its respective normalized distance

References

    1. Werner G. Journal of Physiology - Paris. 2007;101:273–279. - PubMed
    1. Fox MD, Raichle ME. Nat Rev Neurosci. 2007;8:700. - PubMed
    1. Raichle ME, MacLeod AM, Snyder AZ, Powers WJ, Gusnard DA, Shulman GL. Proc Natl Acad Sci USA. 2001;98:676. - PMC - PubMed
    1. Raichle ME. Science. 2006;314:1249. - PubMed
    1. Greicius MD, Krasnow B, Reiss AL, Menon V. Proc Natl Acad Sci USA. 2003;100:253. - PMC - PubMed

Publication types

LinkOut - more resources