

doi: 10.1103/PhysRevLett.102.256804.
Epub 2009 Jun 26.
Probing surface charge fluctuations with solid-state nanopores
Affiliations
- PMID: 19659110
- PMCID: PMC2865846
- DOI: 10.1103/PhysRevLett.102.256804
Item in Clipboard
Probing surface charge fluctuations with solid-state nanopores
Phys Rev Lett.
.
Erratum in
- Phys Rev Lett. 2010 Jul 16;105(3):039902
Abstract
We identify a contribution to the ionic current noise spectrum in solid-state nanopores that exceeds all other noise sources in the frequency band 0.1-10 kHz. Experimental studies of the dependence of this excess noise on pH and electrolyte concentration indicate that the noise arises from surface charge fluctuations. A quantitative model based on surface functional group protonization predicts the observed behaviors and allows us to locally measure protonization reaction rates. This noise can be minimized by operating the nanopore at a deliberately chosen pH.
Figures
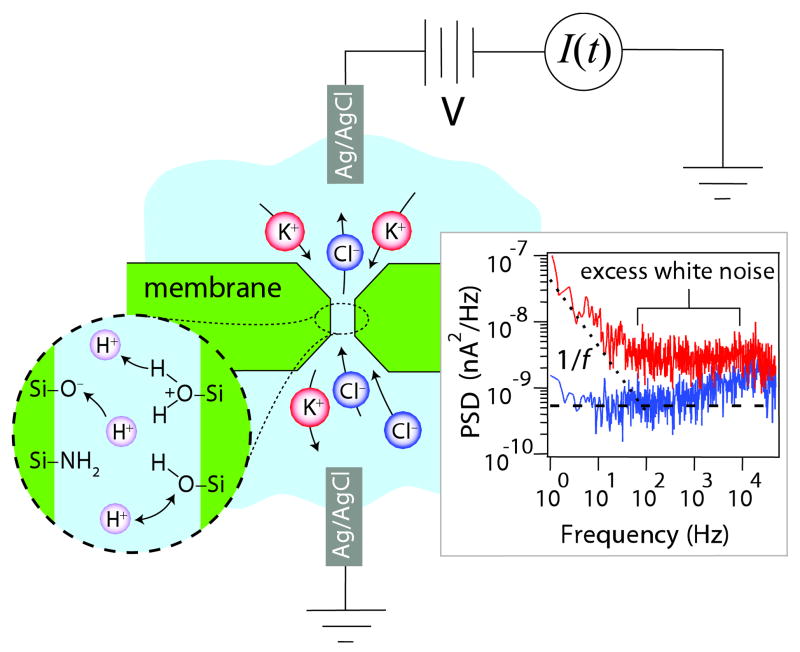
(color online). A nanopore is a narrow channel in a thin Si3.5N4 membrane. A current of electrolyte ions flows through the nanopore in response to an applied voltage. Detail: surface protonization reactions. Inset: Typical current noise spectra at 0 mV (lower trace) and 150 mV (upper trace) applied voltage at 1 M KCl and neutral pH.
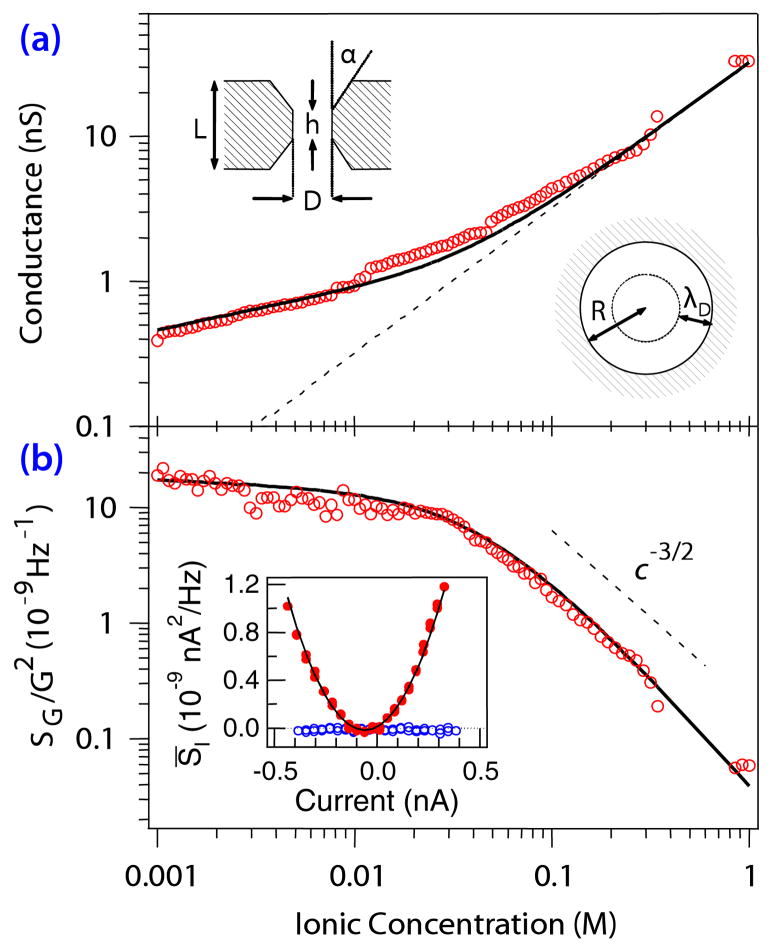
(color online). (a) Dependence of the ionic conductance through the nanopore on bulk electrolyte concentration (open circles), with a fit to the Poisson-Boltzmann model (solid line). Insets: (upper left) A schematic of the geometry [14] used for the Poisson-Boltzmann model, (lower right) The effect of surface fluctuations over the Debye length λD, predicting the c−3/2 dependence of the noise level. (b) Conductance fluctuations vs bulk ionic concentration (open circles). The solid line is the fit, using the same parameters as in (a), to the charge fluctuation model outlined in the text. Inset: Parabolic dependence of the frequency-averaged PSD of SI (closed circles) on current, with fit (solid line).
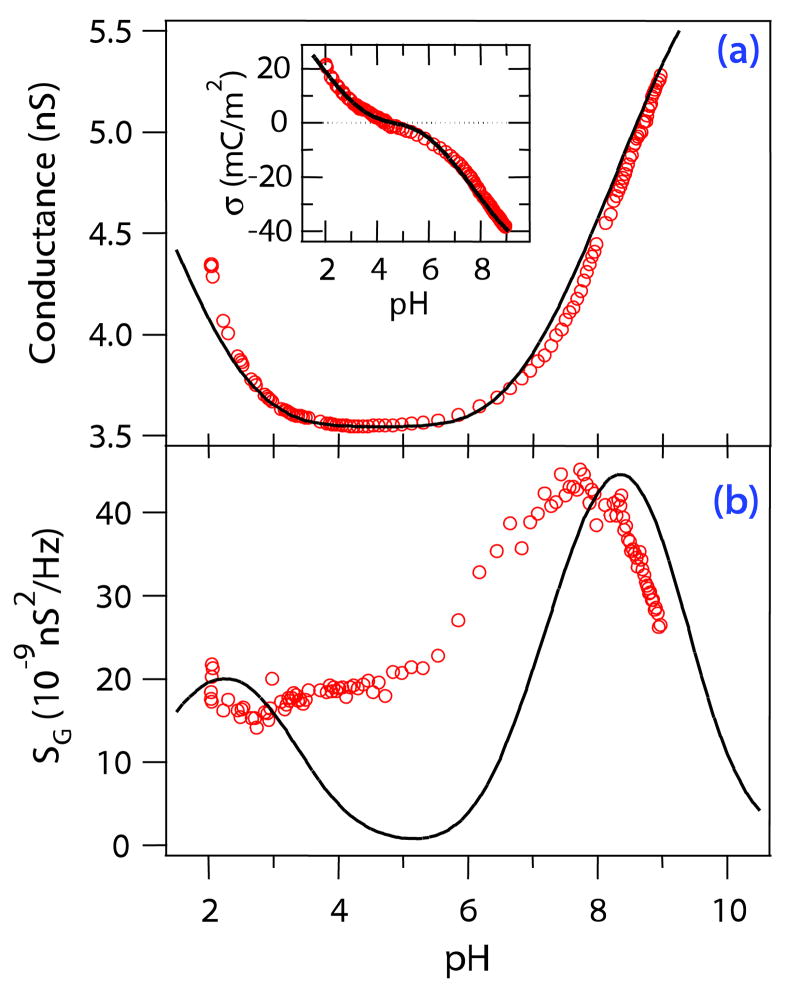
(color online). (a) Measured conductance (open circles) vs pH at constant 110 mM ionic strength. The minimum at pH ~ 4.1 corresponds to the point of zero charge. The solid line represents the predicted conductance from a fluctuating 3-level system. Inset: Surface charge as induced from the data (open circles) and as predicted by the model (solid line). (b) Experimental noise spectral density (open circles) vs pH. The solid line is a fit to the charge fluctuation model presented in the text. Both curves are modeled by the same set of parameters that was used to fit the variable electrolyte concentration data (see Fig. 2).
References
Publication types
MeSH terms
Substances
Grants and funding
LinkOut - more resources
Full Text Sources
Other Literature Sources