. 2009 Aug 6:10:364.
doi: 10.1186/1471-2164-10-364.

Phylogeny and mitochondrial gene order variation in Lophotrochozoa in the light of new mitogenomic data from Nemertea

Affiliations

Phylogeny and mitochondrial gene order variation in Lophotrochozoa in the light of new mitogenomic data from Nemertea

Lars Podsiadlowski et al. BMC Genomics. .

Abstract

Background: The new animal phylogeny established several taxa which were not identified by morphological analyses, most prominently the Ecdysozoa (arthropods, roundworms, priapulids and others) and Lophotrochozoa (molluscs, annelids, brachiopods and others). Lophotrochozoan interrelationships are under discussion, e.g. regarding the position of Nemertea (ribbon worms), which were discussed to be sister group to e.g. Mollusca, Brachiozoa or Platyhelminthes. Mitochondrial genomes contributed well with sequence data and gene order characters to the deep metazoan phylogeny debate.

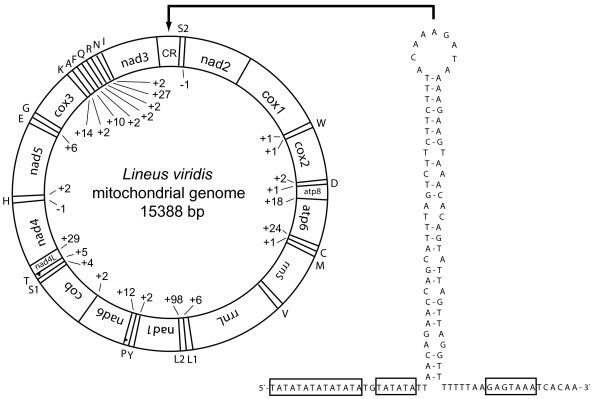
Results: In this study we present the first complete mitochondrial genome record for a member of the Nemertea, Lineus viridis. Except two trnP and trnT, all genes are located on the same strand. While gene order is most similar to that of the brachiopod Terebratulina retusa, sequence based analyses of mitochondrial genes place nemerteans close to molluscs, phoronids and entoprocts without clear preference for one of these taxa as sister group.

Conclusion: Almost all recent analyses with large datasets show good support for a taxon comprising Annelida, Mollusca, Brachiopoda, Phoronida and Nemertea. But the relationships among these taxa vary between different studies. The analysis of gene order differences gives evidence for a multiple independent occurrence of a large inversion in the mitochondrial genome of Lophotrochozoa and a re-inversion of the same part in gastropods. We hypothesize that some regions of the genome have a higher chance for intramolecular recombination than others and gene order data have to be analysed carefully to detect convergent rearrangement events.


Figures

Figure 1
Figure 1
Circular map of the mitochondrial genome of Lineus viridis and stem-loop structure of the control region. tRNA genes are represented by their corresponding amino acid one letter abbreviation. Except trnT and trnP all genes are on the same strand and are oriented (5'-3') in clockwise manner. Numbers (+/-) depict noncoding nucleotides between genes or overlapping nucleotides, respectively. The stem-loop structure is annotated minus-strand like, to show signal sequences (boxed) similar to that found in arthropod control region. The depicted region correspondes to c14260 – c14150 of the GenBank record.
Figure 2
Figure 2
Putative secondary structures of the 22 tRNAs identified in the mitochondrial genome of Lineus viridis.
Figure 3
Figure 3
Mitochondrial gene order of Nemertea and selected lophotrochozoan species. Colour coded genes show different positions from that seen in Lineus viridis, according to transpositions (green) or inversions (yellow, orange). The yellow inversion is a potential synapomorphy. tRNA genes are abbreviated by their amino acids (one letter code). Upper genes are plus-strand encoded, lower genes are minus-strand encoded. Gene orders according to the following references: Cephalothrix [20], Terebratulina [26], Ilyanassa [38], Katharina [30], Phoronis [42], Entoprocta [43].
Figure 4
Figure 4
Best tree from maximum likelihood analysis (RAxML, mtRev+G+I) with the 104 taxa dataset (concatenated amino acid alignments). Numbers indicate bootstrap percentages (>50%). Thick lines for clades indicate bootstrap support of at least 85%. Dotted lines depict taxa appearing as polyphyletic in our analysis. Scale bar depicts substitutions per site. For complete species names and accession numbers of GenBank entries see Additional file 1. Asterisks indicate taxa with incomplete mt genome records.
Figure 5
Figure 5
Best tree from maximum likelihood analysis (RAxML, mtRev+G+I) with the 30 taxa dataset (concatenated amino acid alignments). Numbers indicate bootstrap percentage (RAxML, mtRev+G+I). Thick lines for clades indicate bootstrap support of at least 85%. Dotted lines depict taxa appearing as polyphyletic in our analysis. Scale bar depicts substitutions per site. For complete species names and accession numbers of GenBank entries see [Additional file 1]. Asterisks indicate taxa with incomplete mt genome records.
Figure 6
Figure 6
Best tree from maximum likelihood analysis (Treefinder, mtZoa+G+I) with the 30 taxa dataset (concatenated amino acid alignments). Numbers next to nodes reflect edge support percentage (= LR-ELW) from Treefinder with mtZoa+G+I model (left or upper number), edge support percentage from Treefinder with mtRev+G+I model (middle number) and Bayesian posterior probability (BPP, mtRev+G+I, right or lower number). In the best tree of Treefinder with mtRev+G+I model Myzostoma clustered with Ectoprocta (edge support: 51%). The best tree from Bayesian analysis favoured another topology: Nemertea are sister group to Phoronida+Entoprocta (BPP: 1.0) and Myzostoma clustered with Ectoprocta (BPP: 1.0). Thick lines for clades indicate a combination of edge support above 85% and BPP above 0.95. Scale bar depicts substitutions per site. For complete species names and GenBank accession numbers see Additional file 1. Asterisks indicate taxa with incomplete mt genome records.

References

    1. Aguinaldo AM, Turbeville JM, Linford LS, Rivera MC, Garey JR, Raff RA, et al. Evidence for a clade of nematodes, arthropods and other moulting animals. Nature. 1997;387:489–493. doi: 10.1038/387489a0. - DOI - PubMed
    1. Halanych KM. The new view of animal phylogeny. Annu Rev Ecol Syst. 2004;35:229–256. doi: 10.1146/annurev.ecolsys.35.112202.130124. - DOI
    1. Mallatt J, Giribet G. Further use of nearly complete 28S and 18S rRNA genes to classify Ecdysozoa: 37 more arthropods and a kinorhynch. Mol Phylogenet Evol. 2006;40:772–794. doi: 10.1016/j.ympev.2006.04.021. - DOI - PubMed
    1. Mallatt JM, Garey JR, Shultz JW. Ecdysozoan phylogeny and Bayesian inference: first use of nearly complete 28S and 18S rRNA gene sequences to classify the arthropods and their kin. Mol Phylogenet Evol. 2004;31:178–191. doi: 10.1016/j.ympev.2003.07.013. - DOI - PubMed
    1. Mallatt J, Winchell CJ. Testing the new animal phylogeny: First use of combined large-subunit and small-subunit rRNA gene sequences to classify the protostomes. Mol Biol Evol. 2002;19:289–301. - PubMed

Publication types

LinkOut - more resources