. 2009 Aug 7:10:365.
doi: 10.1186/1471-2164-10-365.

Correlations between RNA and protein expression profiles in 23 human cell lines

Affiliations

Correlations between RNA and protein expression profiles in 23 human cell lines

Marcus Gry et al. BMC Genomics. .

Abstract

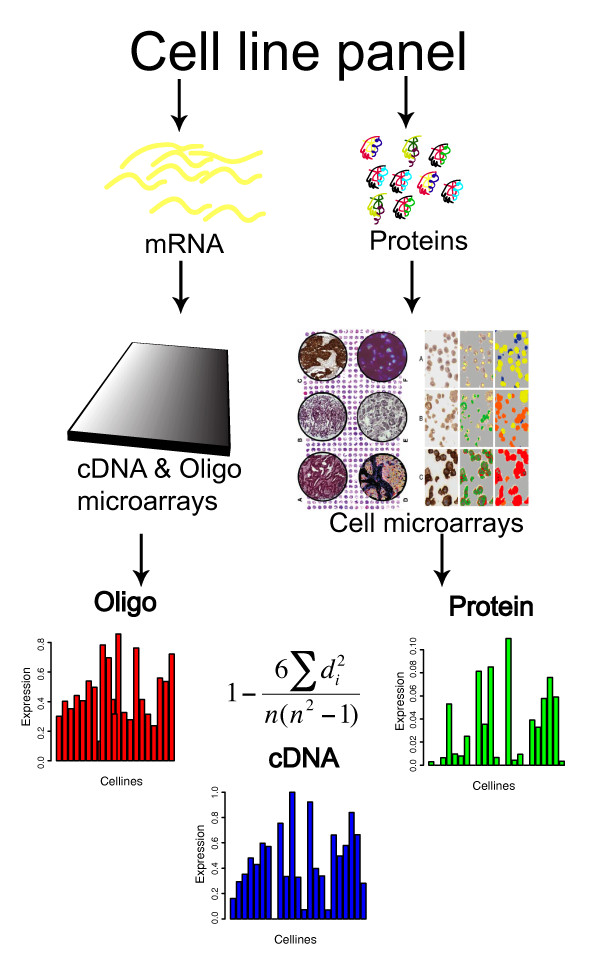
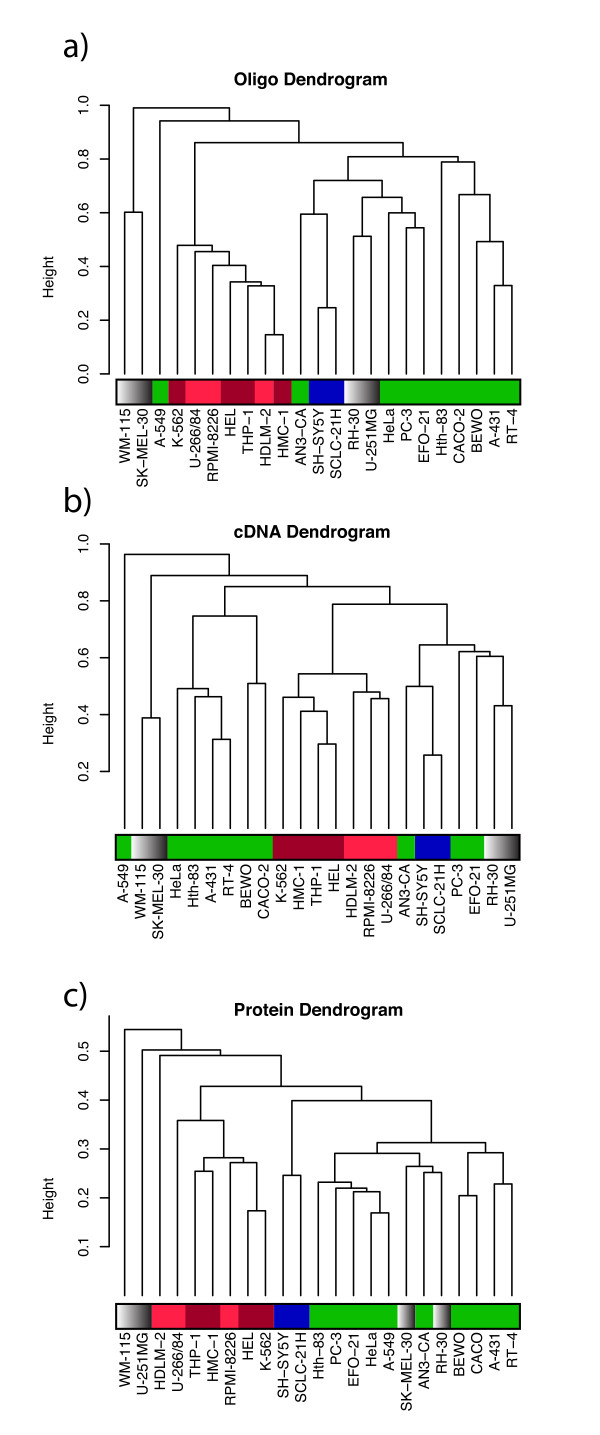
Background: The Central Dogma of biology holds, in famously simplified terms, that DNA makes RNA makes proteins, but there is considerable uncertainty regarding the general, genome-wide correlation between levels of RNA and corresponding proteins. Therefore, to assess degrees of this correlation we compared the RNA profiles (determined using both cDNA- and oligo-based microarrays) and protein profiles (determined immunohistochemically in tissue microarrays) of 1066 gene products in 23 human cell lines.

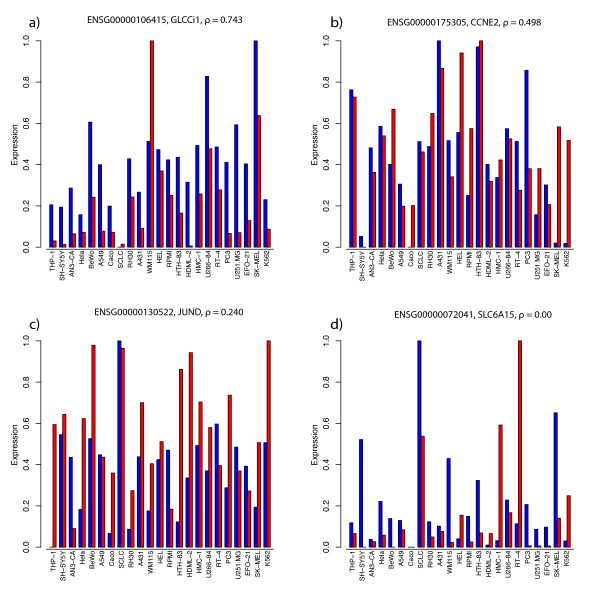
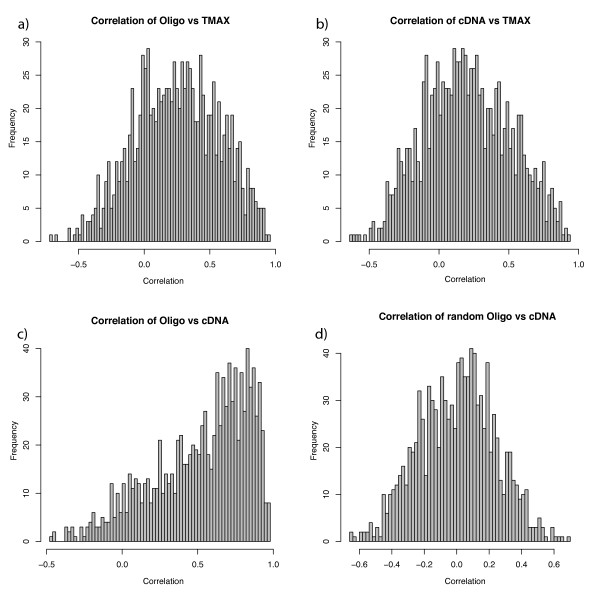
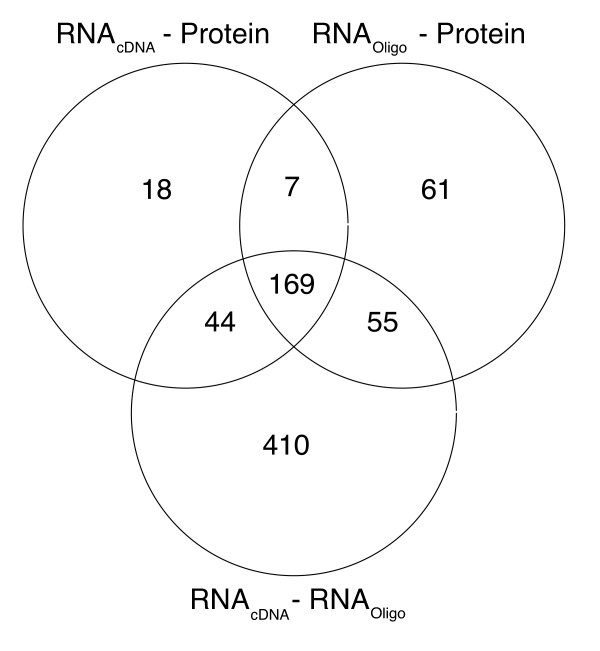
Results: A high mean correlation coefficient (0.52) was obtained from the pairwise comparison of RNA levels determined by the two platforms. Significant correlations, with correlation coefficients exceeding 0.445, between protein and RNA levels were also obtained for a third of the specific gene products. However, the correlation coefficients between levels of RNA and protein products of specific genes varied widely, and the mean correlations between the protein and corresponding RNA levels determined using the cDNA- and oligo-based microarrays were 0.25 and 0.20, respectively.

Conclusion: Significant correlations were found in one third of the examined RNA species and corresponding proteins. These results suggest that RNA profiling might provide indirect support to antibodies' specificity, since whenever a evident correlation between the RNA and protein profiles exists, this can sustain that the antibodies used in the immunoassay recognized their cognate antigens.


Figures

Figure 1
Figure 1
Outline of the experimental procedure. RNA expression profiles were generated using cDNA and oligo microarrays, and protein expression levels were generated using immunohistochemical staining of cell microarrays with antibodies from the Human Protein Atlas initiative. The expression levels were measured in each assay in each of the 23 cell lines. For each of the 1066 gene products for which data were obtained from all three platforms, the Spearman correlation coefficients between the RNA oligo-protein, RNA cDNA-protein and RNA oligo-RNA cDNA datasets were calculated. The equation of the Spearman correlation calculation is shown in the Figure.
Figure 2
Figure 2
Four examples of different correlation coefficients: 0.743, 0.498, 0.240 and 0.00 (from the top left to the bottom right) between expression levels of RNA and protein gene products with corresponding Ensembl IDs (ENSG00000106415, ENSG00000175305, ENSG00000130522 and ENSG00000072041, respectively). The two lines indicate RNA expression levels measured in oligo microarray (blue) and protein expression analyses (red), across 23 cell lines. The values shown have been adjusted to a comparable scale, by adding the absolute value of the lowest RNA oligo value (which is always negative) to all RNA oligo values. All values (RNA oligo and protein) have then been divided by the highest value for the RNA oligo data. This gives measurements on a comparable (0 – 1) scale and the correlation coefficient remains the same as before the adjustment.
Figure 3
Figure 3
Histograms of all correlation coefficients for each gene product obtained from each of the three comparisons, and one showing those of randomly picked Ensembl ID pairs. Figures 3a – 3c show the RNA oligo versus protein profiles, RNA cDNA versus protein profiles, and the RNA oligo versus RNA cDNA profiles, which yielded mean correlation coefficients of 0.25, 0.20 and 0.52, respectively. The distributions of correlation coefficients between RNA values obtained using both RNA platforms and the protein values have Gaussian shapes, but with some bimodal characteristics, in which most of the data points are centered at the respective mean, but shoulders can be seen at correlation coefficients of ~0.5 – 0.7. For the RNA assay correlations the distributions follow a beta distribution. The randomly picked pairs have a mean value close to zero, indicating that there is no apparent bias in the data set.
Figure 4
Figure 4
Venn diagram showing numbers of highly correlating gene products identified in the comparison of data obtained from each permutation of platforms. The gene products that had correlations 0.445 in each comparison (RNAoligo-protein, RNAcDNA-protein and RNAoligo-RNAcDNA) were compared with those identified in the other assays. 169 gene products with such correlations were identified in all three comparisons, equivalent to 63% and 82.5% of those found in the RNA oligo-protein and RNAcDNA-protein comparisons, respectively. The numbers of gene products with correlation coefficients 0.445 in the RNA oligo-protein, RNAcDNA-protein and RNAoligo-RNA cDNA comparisons were 292, 238 and 678, respectively.
Figure 5
Figure 5
Dendrograms of hierarchical clusterings based on 1 – Pearson correlation coefficient metrics. The expression levels of 169 Ensembl gene IDs with correlation coefficients >0.445 for which data were available in all three comparisons across 23 cell lines measured in each assay were utilized to cluster the data into three individual clusters. The cell lines are colored depending on their origins; red, deep-red, grey, green and blue indicate cells of: lymphoid; myeloid; melanoma, glioma and sarcoma; carcinoma and neuronal origins, respectively.

Similar articles

Cited by

References

    1. Asplund A, Gry Bjorklund M, Sundquist C, Stromberg S, Edlund K, Ostman A, Nilsson P, Ponten F, Lundeberg J. Expression profiling of microdissected cell populations selected from basal cells in normal epidermis and basal cell carcinoma. The British journal of dermatology. 2008;158:527–538. doi: 10.1111/j.1365-2133.2007.08418.x. - DOI - PubMed
    1. Dhanasekaran SM, Barrette TR, Ghosh D, Shah R, Varambally S, Kurachi K, Pienta KJ, Rubin MA, Chinnaiyan AM. Delineation of prognostic biomarkers in prostate cancer. Nature. 2001;412:822–826. doi: 10.1038/35090585. - DOI - PubMed
    1. Mousses S, Bubendorf L, Wagner U, Hostetter G, Kononen J, Cornelison R, Goldberger N, Elkahloun AG, Willi N, Koivisto P, et al. Clinical validation of candidate genes associated with prostate cancer progression in the CWR22 model system using tissue microarrays. Cancer research. 2002;62:1256–1260. - PubMed
    1. Fu N, Drinnenberg I, Kelso J, Wu JR, Paabo S, Zeng R, Khaitovich P. Comparison of protein and mRNA expression evolution in humans and chimpanzees. PLoS ONE. 2007;2:e216. doi: 10.1371/journal.pone.0000216. - DOI - PMC - PubMed
    1. Greenbaum D, Colangelo C, Williams K, Gerstein M. Comparing protein abundance and mRNA expression levels on a genomic scale. Genome Biol. 2003;4:117. doi: 10.1186/gb-2003-4-9-117. - DOI - PMC - PubMed

Publication types

LinkOut - more resources