Review
. 2009 Nov 21;261(2):341-60.
doi: 10.1016/j.jtbi.2009.07.038. Epub 2009 Aug 4.

Modeling sequence evolution in acute HIV-1 infection

Affiliations
Review

Modeling sequence evolution in acute HIV-1 infection

Ha Youn Lee et al. J Theor Biol. .

Erratum in

  • J Theor Biol. 2012 Mar 21;297:187

Abstract

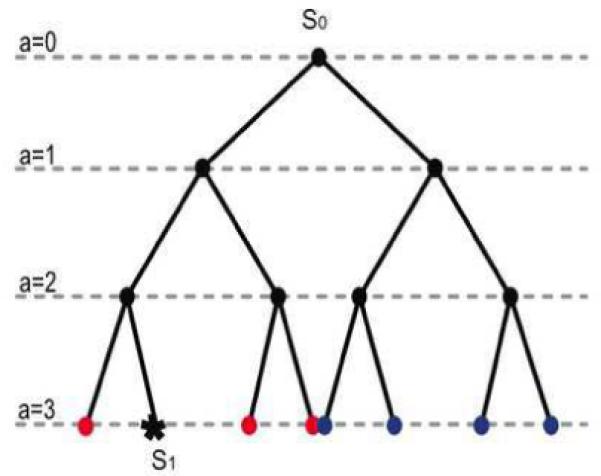
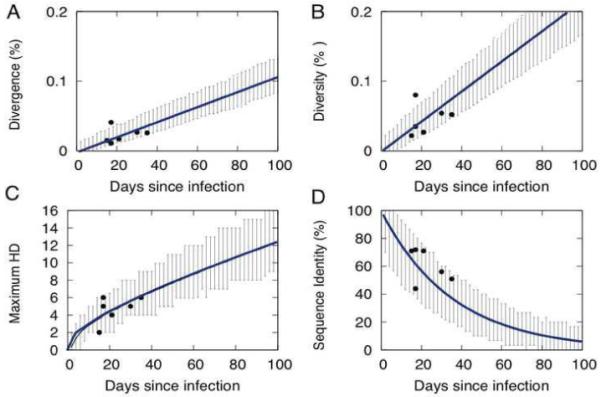
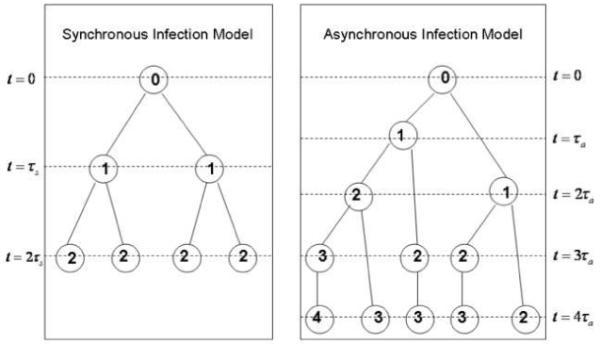
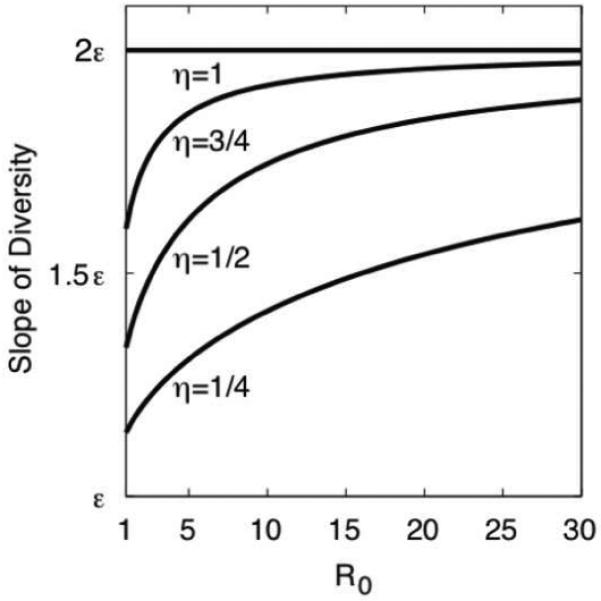
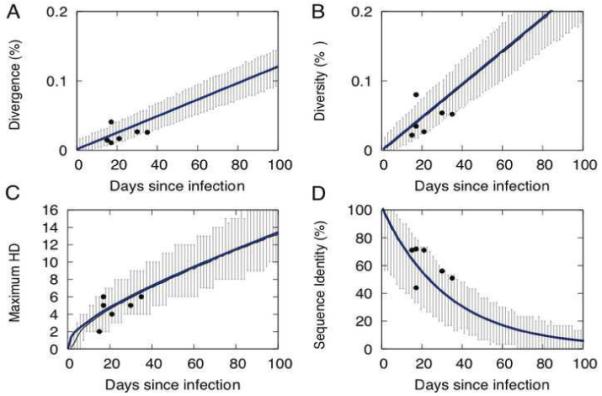
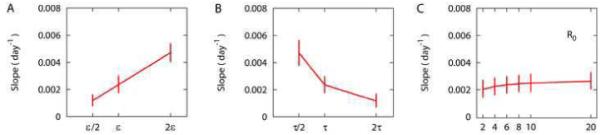
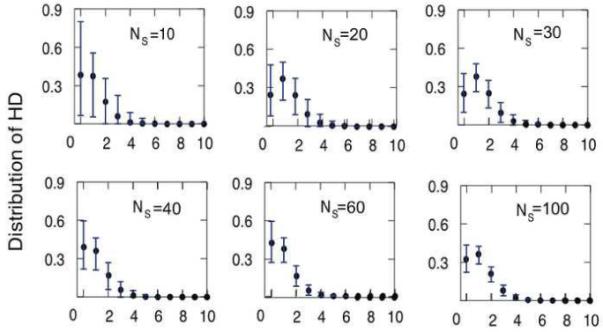
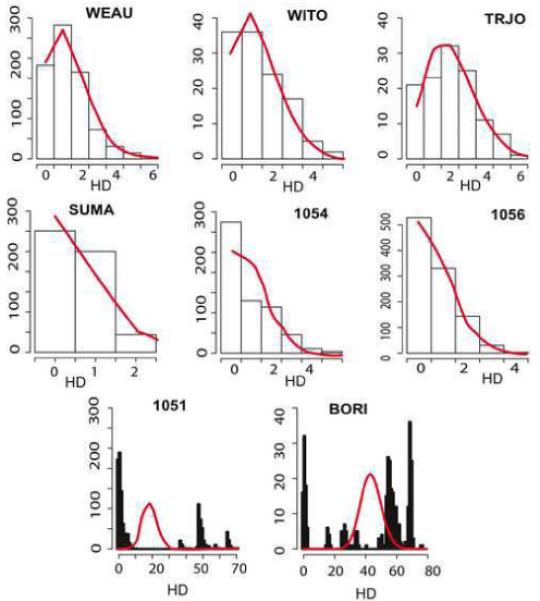
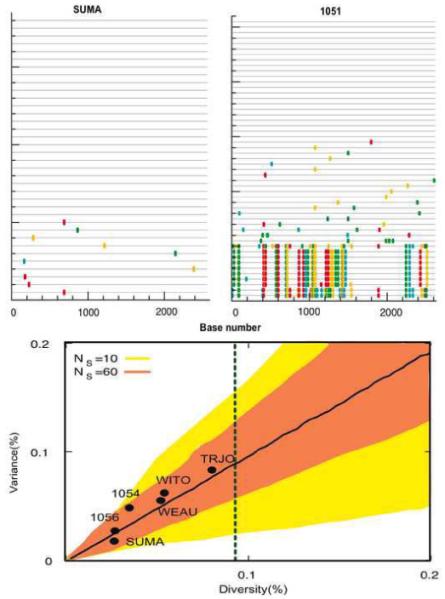
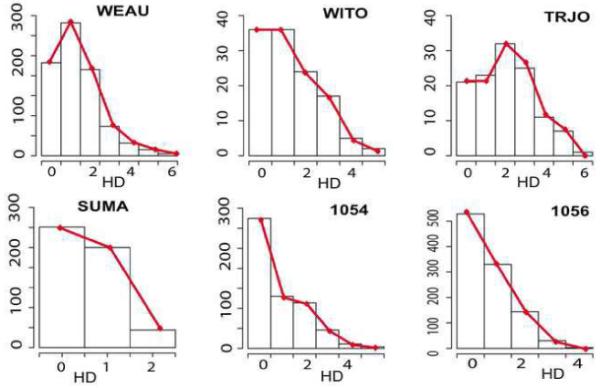
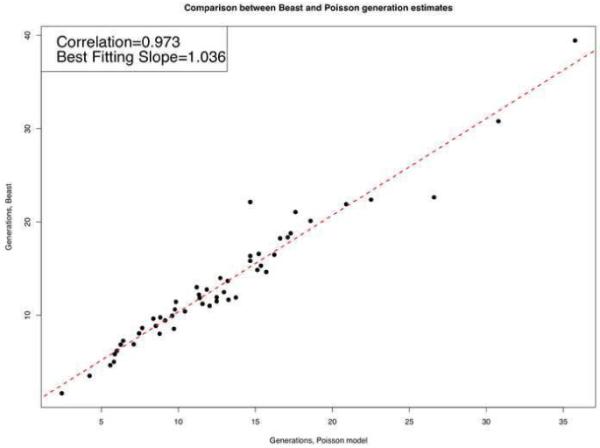
We describe a mathematical model and Monte Carlo (MC) simulation of viral evolution during acute infection. We consider both synchronous and asynchronous processes of viral infection of new target cells. The model enables an assessment of the expected sequence diversity in new HIV-1 infections originating from a single transmitted viral strain, estimation of the most recent common ancestor (MRCA) of the transmitted viral lineage, and estimation of the time to coalesce back to the MRCA. We also calculate the probability of the MRCA being the transmitted virus or an evolved variant. Excluding insertions and deletions, we assume HIV-1 evolves by base substitution without selection pressure during the earliest phase of HIV-1 infection prior to the immune response. Unlike phylogenetic methods that follow a lineage backwards to coalescence, we compare the observed data to a model of the diversification of a viral population forward in time. To illustrate the application of these methods, we provide detailed comparisons of the model and simulations results to 306 envelope sequences obtained from eight newly infected subjects at a single time point. The data from 68 patients were in good agreement with model predictions, and hence compatible with a single-strain infection evolving under no selection pressure. The diversity of the samples from the other two patients was too great to be explained by the model, suggesting multiple HIV-1-strains were transmitted. The model can also be applied to longitudinal patient data to estimate within-host viral evolutionary parameters.


Figures

Figure 1
Figure 1. Probability of early coalescence when R0=2
Let s1 be the randomly picked sequence at generation a=3. The common ancestor between s1 and any of the sequences represented by the blue dots is indeed s0 (the founder strain), whereas the common ancestor between s1 and any of the sequences represented by the red dots sits at generation a=1. There are 22-1 “red” sequences out of a total of 23-1 sequences we could choose s2 from at generation 3. Therefore, the probability of s1 and s2 coalescing at generation m =1 instead of generation 0 is 221231=37=0.43. This probability decreases exponentially as m gets larger. Indeed, by generalizing the above argument, one can see that if s1 is picked at random at generation a, there are exactly R0am1 sequences that coalesce m generations after the founder strain, out of the total of R0a1 sequences s2 could be picked out of. Hence the probability of coalescing a-m generations back, with 1 ≤m < a , is given by P=R0am1R0a1O(R0m), and the probability of coalescing at the founder strain is R0a1R0a1=O(1R0). So, the larger R0, the smaller the error in assuming that everything coalesces at the founder.
Figure 2
Figure 2. Synchronous Infection Model
Dynamics of (A) divergence, (B) diversity, (C) maximum HDI, and (D) the % sequence identity for sequences of length 2600, derived from mathematical model (blue line) and from 103 Monte-Carlo simulations. The coprresponding values for the 6 homogeneous patients are also given (filled circles). In each Monte-Carlo simulation a sample of NS =30 randomly drawn sequences was used to generate the plot and the 95% confidence intervals (black lines). The generation time was assumed to be 2 days in order to convert the results to days since infection.
Figure 3
Figure 3. Schematic diagrams of the synchronous and asynchronous MC infection models
Each circle represents one infected cell, and the number within the circle represents the age of the infected cells’ viral genome measured in terms of the number of times it has been reverse transcribed since the founder strain. The generation time in the synchronous model is τs and τa denotes the time the first infected progeny are produced in the asynchronous model (defined in the text).
Figure 4
Figure 4. The slope of the diversity versus time for different values of η and R0
The diversity depends linearly on the number of generation steps, i.e., diversity = εf(η,R0)n, where n is the number of generation steps and 0<η1. As R0 increases, the slope of the diversity versus time plot increases, and f approaches 2 as R0 increases.
Figure 5
Figure 5. Asynchronous infection model
Dynamics of (A) divergence, (B) diversity, (C) maximum HDI, and (D) the % sequence identity for sequences of length 2600, derived from mathematical model (blue line) and from 103 Monte-Carlo simulations. The coprresponding values for the 6 homogeneous patients are also given (filled circles). In each Monte-Carlo simulation a sample of NS =30 randomly drawn sequences was used to generate the plot and the 95% confidence intervals (black lines).
Figure 6
Figure 6. Parameter dependence (Asynchronous infection model)
The dependence of the slope of the mean diversity, computed from a sample of NS=30 sequences at each time, on (A) the base substitution rate, ε, (B) the generation time, τ, and (C) the basic reproductive number R0. The vertical bars indicate 95% confidence intervals.
Figure 7
Figure 7. Sample size dependence of the Poisson fit
Pairwise HD distribution from the asynchronous MC simulation with different numbers of sampled sequences, Ns, from 10 to 100 at day 20. The average frequency of each HD (black dot) and the 95% confidence interval from 103 MC runs (blue lines) are plotted as a function of HD.
Figure 8
Figure 8. Poisson fit of intersequence Hamming distance distribution
The intersequence HD distributions of 8 acute HIV-1 subjects (black boxes) with the best fitting Poisson distribution (red lines) with parameter λ given by Eq. (21) below. Heterogeneous subjects 1051 and BORI clearly do not present a Poisson behavior. The vertical axis scales differ among patients due to difference in the number of sequences per individual. The three patients in the top row probably represent older infections than those in the middle row (Table 4) reflected in their having a greater mean HD.
Figure 9
Figure 9. Highlighter plots and formal classification diagram
The Highlighter plot (LANL) for subject SUMA (left) shows few and scattered mutations, whereas the analogous for subject 1051 shows frequent and aligned base substitutions (each line in the plots represents a sequence in the sample and the colored ticks represent mutations from the consensus; lines with no ticks are identical to the consensus). In the bottom panel, the diversity and the variance of the sample sequences from subjects with “homogenous” infections (i.e., infections with a single founder strain) are expected to be located within a conical area that depends on the sample size. Here we have used sample sizes of 10 and 60 to draw the yellow and orange areas respectively, which together correspond to the 95% CI from 103 MC runs. The black diagonal line denotes the average relationship between diversity and variance, and the dashed vertical line denotes the average % diversity expected at day 34, which is the upper limit of the cumulative duration for Fiebig stage II (see Table 1). Samples 1051 and BORI are classified as “heterogeneous” infections since there diversities are 0.73% and 1.7% (Table 4), respectively, which places them outside this window.
Figure 10
Figure 10. Comparison between observed intersequence HD frequencies and the theoretical frequencies calculated from Eq. (19)
The histograms are of the observed intersequence HD frequencies, whereas in red are the frequencies computed according to Eq. (19). The two match perfectly except for WEAU, for which an overall 5% difference was found, and TRJO, for which the overall difference was 15%.
Figure 11
Figure 11. Comparison between BEAST results and Poisson model results
The number of generations per sample obtained fitting the Posson model (x-axis) and the ones obtained running the BEAST analysis (y-axis) over a set of 53 patients (Keele et al., 2008).

Similar articles

Cited by

References

    1. Abrahams MR, Anderson JA, Giorgi EE, Seoighe C, Mlisana K, Ping LH, Athreya GS, Treurnicht FK, Keele BF, Wood N, Salazar-Gonzalez JF, Bhattacharya T, Chu H, Hoffman I, Galvin S, Mapanje C, Kazembe P, Thebus R, Fiscus S, Hide W, Cohen MS, Karim SA, Haynes BF, Shaw GM, Hahn BH, Korber BT, Swanstrom R, Williamson C. Quantitating the multiplicity of infection with human immunodeficiency virus type 1 subtype C reveals a non-poisson distribution of transmitted variants. J Virol. 2009;83:3556–67. - PMC - PubMed
    1. Achaz G, Palmer S, Kearney M, Maldarelli F, Mellors JW, Coffin JM, Wakeley J. A robust measure of HIV-1 population turnover within chronically infected individuals. Mol Biol Evol. 2004;21:1902–12. - PubMed
    1. Bourara K, Liegler TJ, Grant RM. Target cell APOBEC3C can induce limited G-to-A mutation in HIV-1. PLoS Pathog. 2007;3:1477–1485. - PMC - PubMed
    1. Casella G, Berger RL. Statistical inference. Brooks/Cole Pub. Co.; Pacific Grove, Calif.: 1990.
    1. Chen HY, Di Mascio M, Perelson AS, Ho DD, Zhang L. Determination of virus burst size in vivo using a single-cycle SIV in rhesus macaques. Proc Natl Acad Sci U S A. 2007;104:19079–84. - PMC - PubMed

Publication types