The QUASAR reproducibility study, Part II: Results from a multi-center Arterial Spin Labeling test-retest study
- PMID: 19660557
- PMCID: PMC2768325
- DOI: 10.1016/j.neuroimage.2009.07.068
The QUASAR reproducibility study, Part II: Results from a multi-center Arterial Spin Labeling test-retest study
Abstract
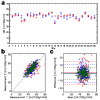
Arterial Spin Labeling (ASL) is a method to measure perfusion using magnetically labeled blood water as an endogenous tracer. Being fully non-invasive, this technique is attractive for longitudinal studies of cerebral blood flow in healthy and diseased individuals, or as a surrogate marker of metabolism. So far, ASL has been restricted mostly to specialist centers due to a generally low SNR of the method and potential issues with user-dependent analysis needed to obtain quantitative measurement of cerebral blood flow (CBF). Here, we evaluated a particular implementation of ASL (called Quantitative STAR labeling of Arterial Regions or QUASAR), a method providing user independent quantification of CBF in a large test-retest study across sites from around the world, dubbed "The QUASAR reproducibility study". Altogether, 28 sites located in Asia, Europe and North America participated and a total of 284 healthy volunteers were scanned. Minimal operator dependence was assured by using an automatic planning tool and its accuracy and potential usefulness in multi-center trials was evaluated as well. Accurate repositioning between sessions was achieved with the automatic planning tool showing mean displacements of 1.87+/-0.95 mm and rotations of 1.56+/-0.66 degrees . Mean gray matter CBF was 47.4+/-7.5 [ml/100 g/min] with a between-subject standard variation SD(b)=5.5 [ml/100 g/min] and a within-subject standard deviation SD(w)=4.7 [ml/100 g/min]. The corresponding repeatability was 13.0 [ml/100 g/min] and was found to be within the range of previous studies.
Figures


References
-
- An H, Lin W. Cerebral venous and arterial blood volumes can be estimated separately in humans using magnetic resonance imaging. Magn Reson.Med. 2002;48:583–588. - PubMed
-
- Bland JM, Altman DG. Statistical methods for assessing agreement between two methods of clinical measurement. Lancet. 1986;1:307–310. - PubMed
-
- Blauenstein UW, Halsey JH, Jr., Wilson EM, Wills EL, Risberg J. 133Xenon inhalation method. Analysis of reproducibility: some of its physiological implications. Stroke. 1977;8:92–102. - PubMed
Publication types
MeSH terms
Substances
Grants and funding
LinkOut - more resources
Full Text Sources

