

Morphometry of human insular cortex and insular volume reduction in Williams syndrome
- PMID: 19660766
- PMCID: PMC2813413
- DOI: 10.1016/j.jpsychires.2009.07.001
Morphometry of human insular cortex and insular volume reduction in Williams syndrome
Abstract
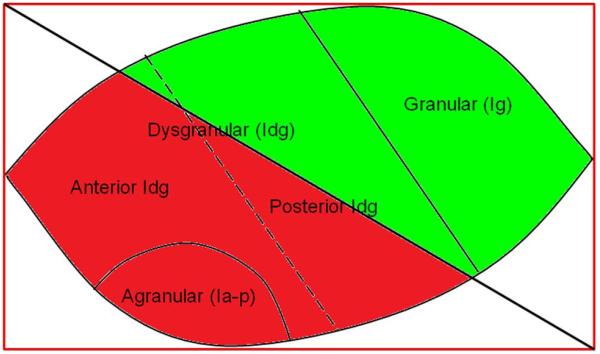
Functional imaging in humans and anatomical data in monkeys have implicated the insula as a multimodal sensory integrative brain region. The topography of insular connections is organized by its cytoarchitectonic regions. Previous attempts to measure the insula have utilized either indirect or automated methods. This study was designed to develop a reliable method for obtaining volumetric magnetic resonance imaging (MRI) measurements of the human insular cortex, and to validate that method by examining the anatomy of insular cortex in adults with Williams syndrome (WS) and healthy age-matched controls. Statistical reliability was obtained among three raters for this method, supporting its reproducibility not only across raters, but within different software packages. The procedure described here utilizes native-space morphometry as well as a method for dividing the insula into connectivity-based sub-regions estimated from cytoarchitectonics. Reliability was calculated in both ANALYZE (N=3) and BrainImageJava (N=10) where brain scans were measured once in each hemisphere by each rater. This highly reliable method revealed total, anterior, and posterior insular volume reduction bilaterally (all p's<.002) in WS, after accounting for reduced total brain volumes in these participants. Although speculative, the reduced insular volumes in WS may represent a neural risk for the development of hyperaffiliative social behavior with increased specific phobias, and implicate the insula as a critical limbic integrative region. Native-space quantification of the insula may be valuable in the study of neurodevelopmental or neuropsychiatric disorders related to anxiety and social behavior.
Copyright 2009 Elsevier Ltd. All rights reserved.
Figures


Similar articles
-
Regional brain differences in cortical thickness, surface area and subcortical volume in individuals with Williams syndrome.PLoS One. 2012;7(2):e31913. doi: 10.1371/journal.pone.0031913. Epub 2012 Feb 15. PLoS One. 2012. PMID: 22355403 Free PMC article.
-
An experiment of nature: brain anatomy parallels cognition and behavior in Williams syndrome.J Neurosci. 2004 May 26;24(21):5009-15. doi: 10.1523/JNEUROSCI.5272-03.2004. J Neurosci. 2004. PMID: 15163693 Free PMC article. Clinical Trial.
-
Abnormal cortical complexity and thickness profiles mapped in Williams syndrome.J Neurosci. 2005 Apr 20;25(16):4146-58. doi: 10.1523/JNEUROSCI.0165-05.2005. J Neurosci. 2005. PMID: 15843618 Free PMC article.
-
At the boundary of the self: the insular cortex in patients with childhood-onset schizophrenia, their healthy siblings, and normal volunteers.Int J Dev Neurosci. 2014 Feb;32:58-63. doi: 10.1016/j.ijdevneu.2013.05.010. Epub 2013 Jun 11. Int J Dev Neurosci. 2014. PMID: 23770018
-
Altered functional organization within the insular cortex in adult males with high-functioning autism spectrum disorder: evidence from connectivity-based parcellation.Mol Autism. 2016 Oct 5;7:41. doi: 10.1186/s13229-016-0106-8. eCollection 2016. Mol Autism. 2016. PMID: 27713815 Free PMC article.
Cited by
-
Regional brain differences in cortical thickness, surface area and subcortical volume in individuals with Williams syndrome.PLoS One. 2012;7(2):e31913. doi: 10.1371/journal.pone.0031913. Epub 2012 Feb 15. PLoS One. 2012. PMID: 22355403 Free PMC article.
-
Magnetic resonance-guided laser interstitial thermal therapy for the treatment of non-lesional insular epilepsy in pediatric patients: thermal dynamic and volumetric factors influencing seizure outcomes.Childs Nerv Syst. 2019 Mar;35(3):453-461. doi: 10.1007/s00381-019-04051-0. Epub 2019 Jan 9. Childs Nerv Syst. 2019. PMID: 30627771
-
The Williams syndrome chromosome 7q11.23 hemideletion confers hypersocial, anxious personality coupled with altered insula structure and function.Proc Natl Acad Sci U S A. 2012 Apr 3;109(14):E860-6. doi: 10.1073/pnas.1114774109. Epub 2012 Mar 12. Proc Natl Acad Sci U S A. 2012. PMID: 22411788 Free PMC article.
-
Reduced insular volume in attention deficit hyperactivity disorder.Psychiatry Res. 2012 Oct 30;204(1):32-9. doi: 10.1016/j.pscychresns.2012.09.009. Epub 2012 Nov 9. Psychiatry Res. 2012. PMID: 23142193 Free PMC article.
-
Effect of nonrigid registration algorithms on deformation-based morphometry: a comparative study with control and Williams syndrome subjects.Magn Reson Imaging. 2012 Jul;30(6):774-88. doi: 10.1016/j.mri.2012.02.005. Epub 2012 Mar 27. Magn Reson Imaging. 2012. PMID: 22459439 Free PMC article.
References
-
- Augustine JR. The insular lobe in primates including humans. Neurology Research. 1985;7:2–10. - PubMed
-
- Augustine JR. Circuitry and functional aspects of the insular lobe in primates including humans. Brain Research Review. 1996;22:229–244. - PubMed
-
- Bellugi U, Lichtenberger L, Jones W, Lai Z, George MI. The cognitive profile of Williams Syndrome: a complex pattern of strengths and weaknesses. Journal of Cognitive Neuroscience. 2000;12(Suppl 1):7–29. - PubMed
-
- Boddaert N, Mochel F, Meresse I, Seidenwurm D, Cachia A, Brunelle F, Lyonnet S, Zilbovicius M. Parieto-occipital grey matter abnormalities in children with Williams syndrome. NeuroImage. 2006;30:721–725. - PubMed
-
- Bonthius DJ, Solodkin A, Van Hoesen GW. Pathology of the insular cortex in Alzheimer disease depends on cortical architecture. Journal of Neuropathology and Experimental Neurology. 2005;64:910–922. - PubMed
Publication types
MeSH terms
Grants and funding
LinkOut - more resources
Full Text Sources
