Associations between cognitive, functional, and FDG-PET measures of decline in AD and MCI
- PMID: 19660834
- PMCID: PMC2891865
- DOI: 10.1016/j.neurobiolaging.2009.07.002
Associations between cognitive, functional, and FDG-PET measures of decline in AD and MCI
Abstract
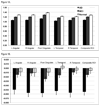
The Functional Activities Questionnaire (FAQ) and Alzheimer's Disease Assessment Scale-cognitive subscale (ADAS-cog) are frequently used indices of cognitive decline in Alzheimer's disease (AD). The goal of this study was to compare FDG-PET and clinical measurements in a large sample of elderly subjects with memory disturbance. We examined relationships between glucose metabolism in FDG-PET regions of interest (FDG-ROIs), and ADAS-cog and FAQ scores in AD and mild cognitive impairment (MCI) patients enrolled in the Alzheimer's Disease Neuroimaging Initiative (ADNI). Low glucose metabolism at baseline predicted subsequent ADAS-cog and FAQ decline. In addition, longitudinal glucose metabolism decline was associated with concurrent ADAS-cog and FAQ decline. Finally, a power analysis revealed that FDG-ROI values have greater statistical power than ADAS-cog to detect attenuation of cognitive decline in AD and MCI patients. Glucose metabolism is a sensitive measure of change in cognition and functional ability in AD and MCI, and has value in predicting future cognitive decline.
Copyright © 2009 Elsevier Inc. All rights reserved.
Conflict of interest statement
Disclosure statement
There are no potential or actual conflicts of interest.
Figures


References
-
- Alexander GE, Chen K, Pietrini P, Rapoport SI, Reiman EM. Longitudinal PET Evaluation of Cerebral Metabolic Decline in Dementia: A Potential Outcome Measure in Alzheimer's Disease Treatment Studies. Am J Psychiatry. 2002;159:738–745. - PubMed
-
- Anchisi D, Borroni B, Franceschi M, Kerrouche N, Kalbe E, Beuthien-Beumann B, Cappa S, Lenz O, Ludecke S, Marcone A, Mielke R, Ortelli P, Padovani A, Pelati O, Pupi A, Scarpini E, Weisenbach S, Herholz K, Salmon E, Holthoff V, Sorbi S, Fazio F, Perani D. Heterogeneity of brain glucose metabolism in mild cognitive impairment and clinical progression to Alzheimer disease. Arch Neurol. 2005;62:1728–1733. - PubMed
-
- Ashburner J, Friston KJ. Unified segmentation. Neuroimage. 2005;26:839–851. - PubMed
-
- Chetelat G, Desgranges B, de la Sayette V, Viader F, Eustache F, Baron JC. Mild cognitive impairment: Can FDG-PET predict who is to rapidly convert to Alzheimer's disease? Neurology. 2003;60:1374–1377. - PubMed
-
- Chetelat G, Eustache F, Viader F, De La Sayette V, Pelerin A, Mezenge F, Hannequin D, Dupuy B, Baron JC, Desgranges B. FDG-PET measurement is more accurate than neuropsychological assessments to predict global cognitive deterioration in patients with mild cognitive impairment. Neurocase. 2005;11:14–25. - PubMed
Publication types
MeSH terms
Substances
Grants and funding
LinkOut - more resources
Full Text Sources
Other Literature Sources
Medical

