. 2009 Aug 7;325(5941):741-4.
doi: 10.1126/science.1172484.

Multiscale mechanics of fibrin polymer: gel stretching with protein unfolding and loss of water

Affiliations

Multiscale mechanics of fibrin polymer: gel stretching with protein unfolding and loss of water

André E X Brown et al. Science. .

Abstract

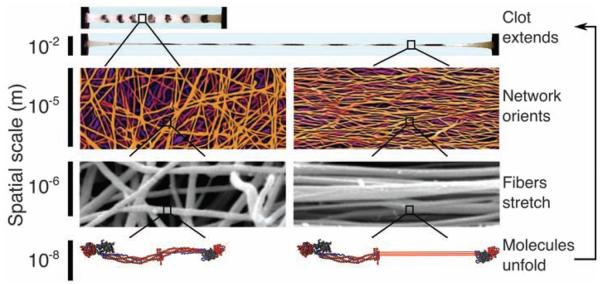
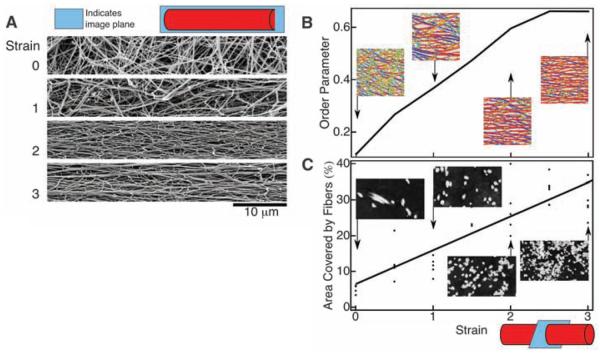
Blood clots and thrombi consist primarily of a mesh of branched fibers made of the protein fibrin. We propose a molecular basis for the marked extensibility and negative compressibility of fibrin gels based on the structural and mechanical properties of clots at the network, fiber, and molecular levels. The force required to stretch a clot initially rises linearly and is accompanied by a dramatic decrease in clot volume and a peak in compressibility. These macroscopic transitions are accompanied by fiber alignment and bundling after forced protein unfolding. Constitutive models are developed to integrate observations at spatial scales that span six orders of magnitude and indicate that gel extensibility and expulsion of water are both manifestations of protein unfolding, which is not apparent in other matrix proteins such as collagen.


Figures

Fig. 1
Fig. 1
Blood clots are highly extensible supramolecular protein polymers formed from well-separated, relatively straight and stiff fibers ~200 nm in diameter. When stretched (see movie S1), the fiber network aligns in the direction of the applied strain and the individual fibers stretch, forcing the fibrin monomers that make up the fibers to extend. Ultimately, it is this molecular unfolding that allows clots to stretch so far. Thus, understanding fibrin clot mechanics requires knowledge of the mechanical response and the corresponding structural changes spanning from the centimeter scale to the nanometer scale.
Fig. 2
Fig. 2
(A)Representative force-extension curve of a cylindrical fibrin clot reaching a threefold longitudinal stretch. The average stretch before breaking was 2.7 ± 0.15–fold (mean ± SEM, n = 6 experiments). As the strain (stretched length/initial length − 1) increases, the force on the clot increases linearly until a strain of ~1.2 is reached, at which point the sample hardens and enters a new regime with a steeper slope (black solid line). The force-extension curve (black solid line) is fit using a constitutive model that takes clot microstructure and protein unfolding into account (red line). Without molecular unfolding [like collagen (7)], the model (black dashed line) rapidly diverges from the experimental data (black solid line). (B) The relative clot volume decreases with strain (black circles), in contrast to the behavior of an incompressible material (dashed black line). This decrease is predicted with the use of the same model and parameters that we used to fit the force-extension data (red line), demonstrating that the volume decrease occurs in parallel with molecular extension (SOM Eq. 29). A decreasing volume with increasing stretch corresponds to a negative compressibility (inset), which indicates that there is a source of free energy to drive contraction, possibly due to fiber bundling when hydrophobic side chains aggregate and bury after exposure during unfolding. The negative compressibility is a property of the network. Proteins in solution have been observed to have intrinsic compressibilities ~2 × 10⁻⁴ MPa−1 (open circle, inset) (13). L, length; Li, initial length; W, width; Wi, initial width.
Fig. 3
Fig. 3
Structural changes in stretched fibrin clots at the network and fiber levels. Scanning electron micrographs of stretched clots (A) show how the fibrin fibers align with strain. (B) These scanning electron micrographs are segmented using a Laplace of Gaussian filter that determines which pixels are fibers and which are background and also calculates the orientation θ at each fiber pixel. The inset images show the results of the segmentation with the color at each pixel corresponding to that pixel's orientation. These data are summarized as an orientational order parameter <cos(2θ)> that can range between 0 for randomly oriented fibers and 1 for perfectly aligned fibers (14). Data points are averages of five fields of view taken randomly over the surface of the clot at each strain. The order parameter was fairly uniform across samples with an average SE of 0.03. (C) Transmission electron micrographs of transverse sections through unstretched and stretched clots show fiber bundling (insets). The plot shows the total cross-sectional area covered by fibers (black points on the plot, each representing a randomly chosen field of view), which is used to calculate the force per fiber as a function of strain from the total force applied to the sample. Inset images are 4 μm across. At least 10 scanning and transmission electron microscope images at each strain were obtained from two independently prepared samples with similar results.
Fig. 4
Fig. 4
Structural changes in stretched fibrin clots at the molecular level. (A) Schematic of afibrin protofibril showing the half-staggered pattern that leads to a characteristic 22-nm repeat. A fibrin monomer within the protofibril is shown in red. (B) SAXS from fibrin clots leads to a clear first-order peak (white arrow, inset) and to third- and fourth-order peaks. The plots show the peak shape as a function of the wave vector q = 2π/d, which increases radially from the center (here, d is the fibrin periodicity, 22 nm). The thick lines are fits to the data using the sum of an exponential and a Gaussian with the exponential alone (thin lines) shown for comparison. The width of the peak increases with increasing stretch, which can be understood in terms of a two-state—like extension of fibrin molecules that introduce defects into the sample. a.u., arbitrary units. (C) This effect is quantified as the Scherrer length L, which decreaseswith increasing strain (red). The decrease is more rapid for samples that were prealigned in a magnetic field during polymerization (blue), which implies that network alignment accommodates some strain and delays unfolding. The transition is reversible when samples are allowed to relax, as indicated by the blue arrow. When samples are not ligated using factor XIIIa, protofibril sliding becomes important, and unfolding is decreased. In all cases, the peak position remains relatively constant, implying that there is no gradual lengthening of the whole population of fibrin monomers. Instead, there remains a population that is not unfolded and maintains a fairly constant spacing. Error bars indicate SDs of the distribution of L determined from fits using the bootstrap method. This bootstrap error is similar to the average SE of 15 nm calculated by averaging over results from four samples. (D) This behavior is captured by the constitutive model in which the fraction of folded monomers nf decreases with increasing strain.

References

    1. Weisel JW. Advances in Protein Chemistry. Vol. 70. Academic Press; London: 2005. pp. 247–299. - PubMed
    1. Laurens N, Koolwijk P, DeMaat MPM. J. Thromb. Haemost. 2006;4:932. - PubMed
    1. Colman RW, et al. Hemostasis and Thrombosis: Basic Principles and Clinical Practice. Lippincott Williams & Wilkins; Philadelphia: 2005.
    1. Weisel JW. Biophys. Chem. 2004;112:267. - PubMed
    1. Collet JP, et al. Arterioscler. Thromb. Vasc. Biol. 2000;20:1354. - PubMed

Publication types