Using lidocaine and benzocaine to link sodium channel molecular conformations to state-dependent antiarrhythmic drug affinity
- PMID: 19661462
- PMCID: PMC2735213
- DOI: 10.1161/CIRCRESAHA.109.198572
Using lidocaine and benzocaine to link sodium channel molecular conformations to state-dependent antiarrhythmic drug affinity
Abstract
Rationale: Lidocaine and other antiarrhythmic drugs bind in the inner pore of voltage-gated Na channels and affect gating use-dependently. A phenylalanine in domain IV, S6 (Phe1759 in Na(V)1.5), modeled to face the inner pore just below the selectivity filter, is critical in use-dependent drug block.
Objective: Measurement of gating currents and concentration-dependent availability curves to determine the role of Phe1759 in coupling of drug binding to the gating changes.
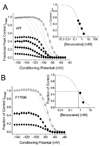
Methods and results: The measurements showed that replacement of Phe1759 with a nonaromatic residue permits clear separation of action of lidocaine and benzocaine into 2 components that can be related to channel conformations. One component represents the drug acting as a voltage-independent, low-affinity blocker of closed channels (designated as lipophilic block), and the second represents high-affinity, voltage-dependent block of open/inactivated channels linked to stabilization of the S4s in domains III and IV (designated as voltage-sensor inhibition) by Phe1759. A homology model for how lidocaine and benzocaine bind in the closed and open/inactivated channel conformation is proposed.
Conclusions: These 2 components, lipophilic block and voltage-sensor inhibition, can explain the differences in estimates between tonic and open-state/inactivated-state affinities, and they identify how differences in affinity for the 2 binding conformations can control use-dependence, the hallmark of successful antiarrhythmic drugs.
Figures


Similar articles
-
Outward stabilization of the S4 segments in domains III and IV enhances lidocaine block of sodium channels.J Physiol. 2007 Jul 1;582(Pt 1):317-34. doi: 10.1113/jphysiol.2007.134262. Epub 2007 May 17. J Physiol. 2007. PMID: 17510181 Free PMC article.
-
Charge at the lidocaine binding site residue Phe-1759 affects permeation in human cardiac voltage-gated sodium channels.J Physiol. 2007 Jun 1;581(Pt 2):741-55. doi: 10.1113/jphysiol.2007.130161. Epub 2007 Mar 15. J Physiol. 2007. PMID: 17363383 Free PMC article.
-
Block of inactivation-deficient Na+ channels by local anesthetics in stably transfected mammalian cells: evidence for drug binding along the activation pathway.J Gen Physiol. 2004 Dec;124(6):691-701. doi: 10.1085/jgp.200409128. Epub 2004 Nov 15. J Gen Physiol. 2004. PMID: 15545401 Free PMC article.
-
Sodium channel molecular conformations and antiarrhythmic drug affinity.Trends Cardiovasc Med. 2010 Jan;20(1):16-21. doi: 10.1016/j.tcm.2010.03.002. Trends Cardiovasc Med. 2010. PMID: 20685573 Free PMC article. Review.
-
Molecular properties of brain sodium channels: an important target for anticonvulsant drugs.Adv Neurol. 1999;79:441-56. Adv Neurol. 1999. PMID: 10514834 Review.
Cited by
-
Comparison of Gating Properties and Use-Dependent Block of Nav1.5 and Nav1.7 Channels by Anti-Arrhythmics Mexiletine and Lidocaine.PLoS One. 2015 Jun 11;10(6):e0128653. doi: 10.1371/journal.pone.0128653. eCollection 2015. PLoS One. 2015. PMID: 26068619 Free PMC article.
-
The human Nav1.5 F1486 deletion associated with long QT syndrome leads to impaired sodium channel inactivation and reduced lidocaine sensitivity.J Physiol. 2012 Oct 15;590(20):5123-39. doi: 10.1113/jphysiol.2012.235374. Epub 2012 Jul 23. J Physiol. 2012. PMID: 22826127 Free PMC article.
-
Predicting Patient Response to the Antiarrhythmic Mexiletine Based on Genetic Variation.Circ Res. 2019 Feb 15;124(4):539-552. doi: 10.1161/CIRCRESAHA.118.314050. Circ Res. 2019. PMID: 30566038 Free PMC article. Clinical Trial.
-
Voltage-dependent blockade by bupivacaine of cardiac sodium channels expressed in Xenopus oocytes.Neurosci Bull. 2014 Aug;30(4):697-710. doi: 10.1007/s12264-013-1449-1. Epub 2014 Jul 9. Neurosci Bull. 2014. PMID: 25008571 Free PMC article.
-
Bisphenol A binds to the local anesthetic receptor site to block the human cardiac sodium channel.PLoS One. 2012;7(7):e41667. doi: 10.1371/journal.pone.0041667. Epub 2012 Jul 27. PLoS One. 2012. PMID: 22848561 Free PMC article.
References
-
- Starmer CF, Hollett MD. Mechanisms of apparent affinity variation of guarded receptors. J Theor Biol. 1985;115:337–349. - PubMed
-
- Li HL, Galue A, Meadows L, Ragsdale DS. A molecular basis for the different local anesthetic affinities of resting versus open and inactivated states of the sodium channel. Mol Pharmacol. 1999;55:134–141. - PubMed
Publication types
MeSH terms
Substances
Grants and funding
LinkOut - more resources
Full Text Sources
Other Literature Sources
Miscellaneous

