

Predicting control of primary tumor and survival by DCE MRI during early therapy in cervical cancer
- PMID: 19661844
- PMCID: PMC2782687
- DOI: 10.1097/RLI.0b013e3181a64ce9
Predicting control of primary tumor and survival by DCE MRI during early therapy in cervical cancer
Abstract
Purpose: To assess the early predictive power of MRI perfusion and volume parameters, during early treatment of cervical cancer, for primary tumor control and disease-free-survival.
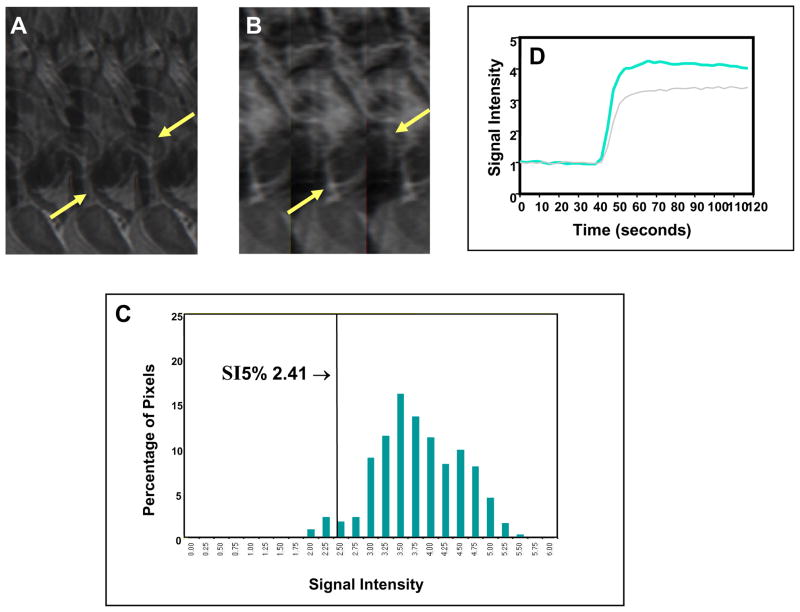
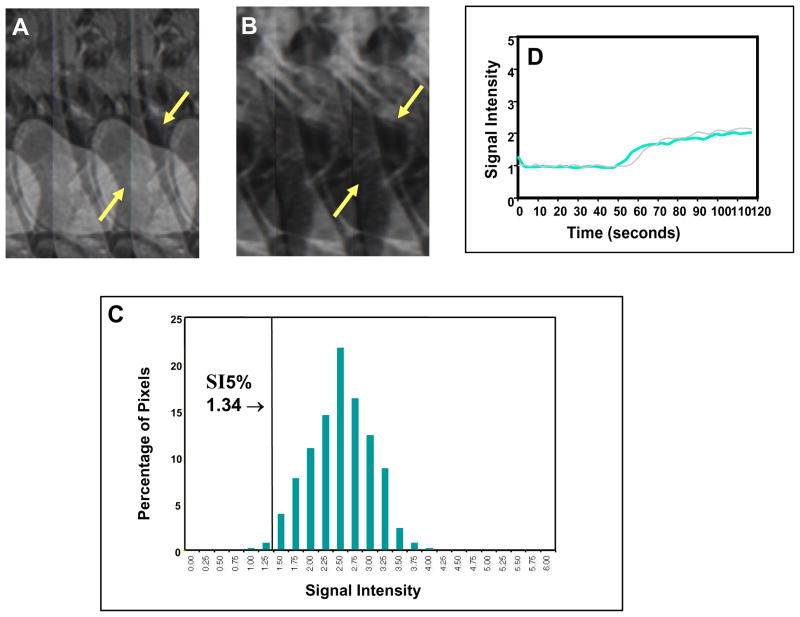
Materials and methods: Three MRI examinations were obtained in 101 patients before and during therapy (at 2-2.5 and 4-5 weeks) for serial dynamic contrast enhanced (DCE) perfusion MRI and 3-dimensional tumor volume measurement. Plateau Signal Intensity (SI) of the DCE curves for each tumor pixel of all 3 MRI examinations was generated, and pixel-SI distribution histograms were established to characterize the heterogeneous tumor. The degree and quantity of the poorly-perfused tumor subregions, which were represented by low-DCE pixels, was analyzed by using various lower percentiles of SI (SI%) from the pixel histogram. SI% ranged from SI2.5% to SI20% with increments of 2.5%. SI%, mean SI, and 3-dimensional volume of the tumor were correlated with primary tumor control and disease-free-survival, using Student t test, Kaplan-Meier analysis, and log-rank test. The mean post-therapy follow-up time for outcome assessment was 6.8 years (range: 0.2-9.4 years).
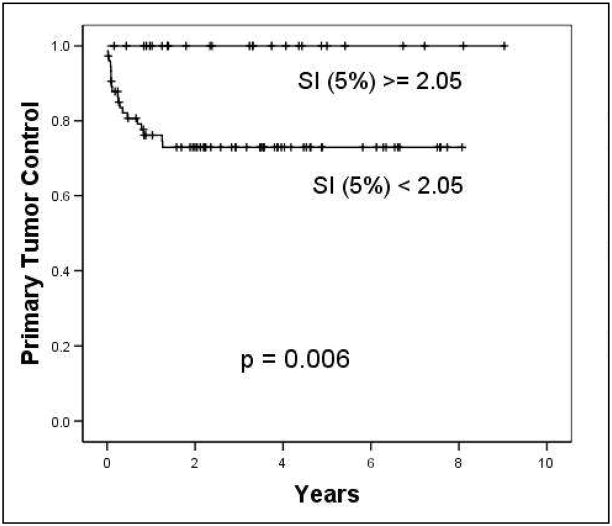
Results: Tumor volume, mean SI, and SI% showed significant prediction of the long-term clinical outcome, and this prediction was provided as early as 2 to 2.5 weeks into treatment. An SI5% of <2.05 and residual tumor volume of > or =30 cm(3) in the MRI obtained at 2 to 2.5 weeks of therapy provided the best prediction of unfavorable 8-year primary tumor control (73% vs. 100%, P = 0.006) and disease-free-survival rate (47% vs. 79%, P = 0.001), respectively.
Conclusions: Our results show that MRI parameters quantifying perfusion status and residual tumor volume provide very early prediction of primary tumor control and disease-free-survival. This functional imaging based outcome predictor can be obtained in the very early phase of cytotoxic therapy within 2 to 2.5 weeks of therapy start. The predictive capacity of these MRI parameters, indirectly reflecting the heterogeneous delivery pattern of cytotoxic agents, tumor oxygenation, and the bulk of residual presumably therapy-resistant tumor, requires future study.
Figures

Similar articles
-
Characterizing tumor heterogeneity with functional imaging and quantifying high-risk tumor volume for early prediction of treatment outcome: cervical cancer as a model.Int J Radiat Oncol Biol Phys. 2012 Jul 1;83(3):972-9. doi: 10.1016/j.ijrobp.2011.08.011. Epub 2011 Dec 28. Int J Radiat Oncol Biol Phys. 2012. PMID: 22208967 Free PMC article.
-
Ultra-early predictive assay for treatment failure using functional magnetic resonance imaging and clinical prognostic parameters in cervical cancer.Cancer. 2010 Feb 15;116(4):903-12. doi: 10.1002/cncr.24822. Cancer. 2010. PMID: 20052727 Free PMC article.
-
Longitudinal changes in tumor perfusion pattern during the radiation therapy course and its clinical impact in cervical cancer.Int J Radiat Oncol Biol Phys. 2010 Jun 1;77(2):502-8. doi: 10.1016/j.ijrobp.2009.04.084. Epub 2009 Sep 21. Int J Radiat Oncol Biol Phys. 2010. PMID: 19775824
-
Validation of optimal DCE-MRI perfusion threshold to classify at-risk tumor imaging voxels in heterogeneous cervical cancer for outcome prediction.Magn Reson Imaging. 2014 Dec;32(10):1198-205. doi: 10.1016/j.mri.2014.08.039. Epub 2014 Aug 29. Magn Reson Imaging. 2014. PMID: 25179141 Free PMC article.
-
Uterine cervical carcinoma: comparison of standard and pharmacokinetic analysis of time-intensity curves for assessment of tumor angiogenesis and patient survival.Cancer Res. 1998 Aug 15;58(16):3598-602. Cancer Res. 1998. PMID: 9721867
Cited by
-
Magnetic resonance imaging biomarkers in hepatocellular carcinoma: association with response and circulating biomarkers after sunitinib therapy.J Hematol Oncol. 2013 Jul 10;6:51. doi: 10.1186/1756-8722-6-51. J Hematol Oncol. 2013. PMID: 23842041 Free PMC article. Clinical Trial.
-
The Microenvironment of Cervical Carcinoma Xenografts: Associations with Lymph Node Metastasis and Its Assessment by DCE-MRI.Transl Oncol. 2013 Oct 1;6(5):607-17. doi: 10.1593/tlo.13313. eCollection 2013. Transl Oncol. 2013. PMID: 24151541 Free PMC article.
-
DCE-MRI of locally-advanced carcinoma of the uterine cervix: Tofts analysis versus non-model-based analyses.Radiat Oncol. 2020 Apr 15;15(1):79. doi: 10.1186/s13014-020-01526-2. Radiat Oncol. 2020. PMID: 32293487 Free PMC article.
-
Onset time of tumor repopulation for cervical cancer: first evidence from clinical data.Int J Radiat Oncol Biol Phys. 2012 Oct 1;84(2):478-84. doi: 10.1016/j.ijrobp.2011.12.037. Epub 2012 Mar 2. Int J Radiat Oncol Biol Phys. 2012. PMID: 22386374 Free PMC article.
-
Characterizing tumor heterogeneity with functional imaging and quantifying high-risk tumor volume for early prediction of treatment outcome: cervical cancer as a model.Int J Radiat Oncol Biol Phys. 2012 Jul 1;83(3):972-9. doi: 10.1016/j.ijrobp.2011.08.011. Epub 2011 Dec 28. Int J Radiat Oncol Biol Phys. 2012. PMID: 22208967 Free PMC article.
References
-
- Rose PG, Bundy BN, Watkins EB, et al. Concurrent Cisplatin-based radiotherapy and chemotherapy for locally advanced cervical cancer. N Engl J Med. 1999;340:1144–1153. - PubMed
-
- Eifel PJ. Problems with the clinical staging of carcinoma of the cervix. Sem in Radiat Oncol. 1994;4:1–8. - PubMed
-
- Taylor JS, Tofts PS, Port RE, et al. MR imaging of tumor microcirculation: promise for the new millennium. J Magn Reson Imaging. 1999;10:903–907. - PubMed
-
- Yuh WTC. An exciting and challenging role for the advanced contrast MR imaging. J Magn Reson Imaging. 1999;10:221–222. - PubMed
-
- Knopp MV, Giesel FL, Marcos H, von Tengg-Kobligk H, Choyke P. Dynamic contrast-enhanced magnetic resonance imaging in oncology. Top Magn Reson Imaging. 2001;12:301–308. - PubMed
