. 2010 Mar;31(3):353-64.
doi: 10.1002/hbm.20870.

Brain structure and obesity

Affiliations

Brain structure and obesity

Cyrus A Raji et al. Hum Brain Mapp. 2010 Mar.

Abstract

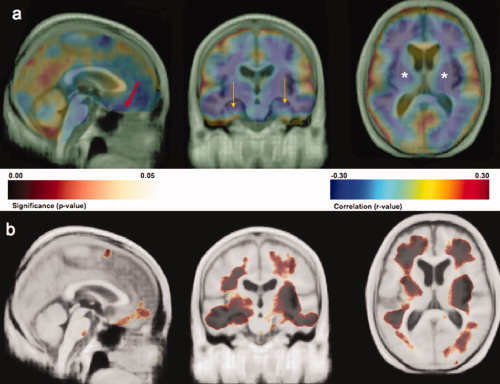
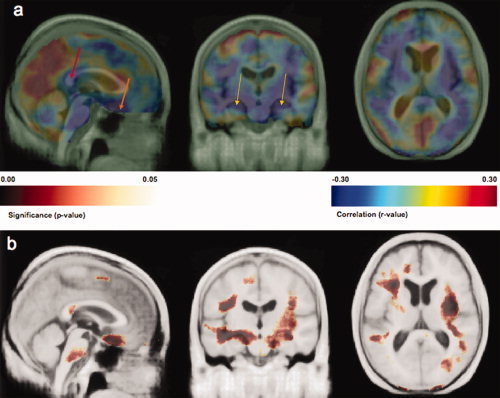
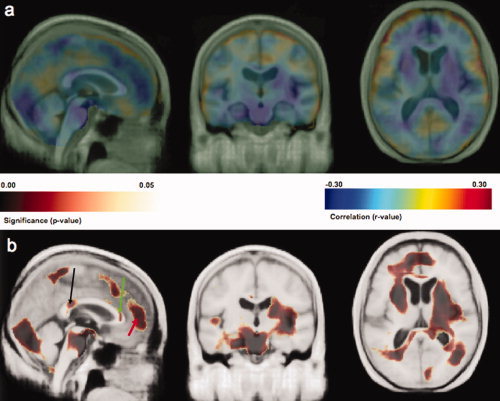
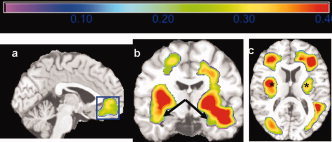
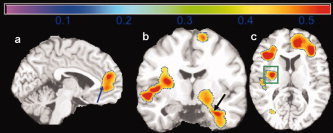
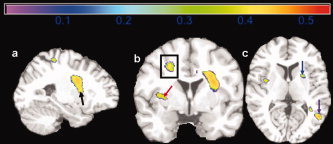
Obesity is associated with increased risk for cardiovascular health problems including diabetes, hypertension, and stroke. These cardiovascular afflictions increase risk for cognitive decline and dementia, but it is unknown whether these factors, specifically obesity and Type II diabetes, are associated with specific patterns of brain atrophy. We used tensor-based morphometry (TBM) to examine gray matter (GM) and white matter (WM) volume differences in 94 elderly subjects who remained cognitively normal for at least 5 years after their scan. Bivariate analyses with corrections for multiple comparisons strongly linked body mass index (BMI), fasting plasma insulin (FPI) levels, and Type II Diabetes Mellitus (DM2) with atrophy in frontal, temporal, and subcortical brain regions. A multiple regression model, also correcting for multiple comparisons, revealed that BMI was still negatively correlated with brain atrophy (FDR <5%), while DM2 and FPI were no longer associated with any volume differences. In an Analysis of Covariance (ANCOVA) model controlling for age, gender, and race, obese subjects with a high BMI (BMI > 30) showed atrophy in the frontal lobes, anterior cingulate gyrus, hippocampus, and thalamus compared with individuals with a normal BMI (18.5-25). Overweight subjects (BMI: 25-30) had atrophy in the basal ganglia and corona radiata of the WM. Overall brain volume did not differ between overweight and obese persons. Higher BMI was associated with lower brain volumes in overweight and obese elderly subjects. Obesity is therefore associated with detectable brain volume deficits in cognitively normal elderly subjects.


Figures

Figure 1
Figure 1
Part a shows an r‐value (Pearson correlation coefficient) map highlighting the negative and positive correlations between BMI and brain structure projected onto cardinal sections of the Cardiovascular Health Study Minimal Deformation Template (CHS‐MDT). Blue colors show stronger negative correlations while red and yellow colors show positive correlations; only negative correlations were statistically significant (p < 0.001; permutations test). An inverse association between BMI and brain volume is observed in orbital frontal cortex (red arrow at x = −9, y = 57, z = 29, r = −0.31), the hippocampus (gold arrows: left at x = −31, y = −2, z = 25, r = −0.32; right at x = 32, x = 9, z = 18, r = −0.31) and subcortical areas (white asterisks: left at x = −28, y = −14, z = 1, r = −0.30; right at x = 29, y = −15, z = 1, r = −0.34) including the putamen, globus pallidus, and thalamus. Part b shows a P‐value image of BMI main effects on brain structure projected onto the CHS‐MDT. All images are in neurological convention (left on left). Dark colors indicate atrophy in both GM and WM; darker colors denote lower P‐values. [Color figure can be viewed in the online issue, which is available at www.interscience.wiley.com.]
Figure 2
Figure 2
Part a shows a correlation map projected onto the CHS‐MDT template indicating where brain atrophy (volume reduction) is related to higher fasting plasma insulin levels. Higher FPI is correlated to lower volumes of the splenium of the corpus callosum (red arrow: x = −3, y = 12, z = −12, r = −0.27), orbital frontal cortex (orange arrow: x = −3, y = −39, z = 31, r = −0.33) and hippocampus (gold arrows: left at x = −24, y = −1, z = 24, r = −0.31; right at x = 31, x = 3, z = 21, r = −0.33). Part b shows the corresponding significance maps. [Color figure can be viewed in the online issue, which is available at www.interscience.wiley.com.]
Figure 3
Figure 3
The r‐value image in part a shows the negative correlation between a categorical diagnosis of DM2 and atrophy in GM and WM. DM2 is associated with lower volumes in splenium of the corpus callosum (Fig. 3 b, significance map, black arrow, corresponding r‐value = −0.21 at x = −4, y = 14, z = −17), genu of the corpus callosum (Fig. 3 b, green arrow, corresponding r‐value = −0.17 at x = 4, y = −49, z = 1) and the frontal lobes (Fig. 3b, red arrow, corresponding r‐value = −0.24 at x = −7, y = −77, z = 7). All results in this image were projected onto the CHS‐MDT. [Color figure can be viewed in the online issue, which is available at www.interscience.wiley.com.]
Figure 4
Figure 4
This figure shows a map of correlation values (r‐value map) projected onto the Standard Single Subject MNI brain template for display purposes. The correlation shown is between higher BMI and GM/WM atrophy controlling for age, gender, race, and DM2. Hotter colors denote stronger correlation effect sizes, which range from 0 to 0.4. Higher BMI was associated with lower GM and WM volumes in orbital frontal cortex (a, blue box), anterior cingulate gyrus (a, blue box), medial temporal lobe (b, black arrows), and subcortical WM (c, black asterisks). [Color figure can be viewed in the online issue, which is available at www.interscience.wiley.com.]
Figure 5
Figure 5
Correlation map (r‐value image) effect sizes for a comparison of 14 obese persons (BMI > 30) to 29 normal weight persons (18.5–25). Obese persons had lower GM and WM volumes in the frontal lobes, anterior cingulate gyrus (a, blue arrow), hippocampus (b, black arrow), and basal ganglia (c, green box). Correlation coefficients range from 0 to 0.5. [Color figure can be viewed in the online issue, which is available at www.interscience.wiley.com.]
Figure 6
Figure 6
Maps of correlation coefficients are shown for a group comparison of 51 overweight persons (BMI: 25–30) versus 29 normal weight persons (18.5–25). Atrophy in the overweight group is seen in the basal ganglia (a, black arrow; b, red arrow; c, blue arrow), corona radiata (b, black box), and parietal lobe (c, purple arrow). Correlations range from 0 to 0.5. [Color figure can be viewed in the online issue, which is available at www.interscience.wiley.com.]

References

    1. Apostolova LG, Dutton RA, Dinov ID, Hayashi KM, Toga AW, Cummings JL, Thompson PM ( 2006): Conversion of mild cognitive impairment to Alzheimer disease predicted by hippocampal atrophy maps. Arch Neurol 63: 693–699. - PubMed
    1. Arvanitakis Z, Schneider JA, Wilson RS, Li Y, Arnold SE, Wang Z, Bennett DA ( 2006): Diabetes is related to cerebral infarction but not to AD pathology in older persons. Neurology 67: 1960–1965. - PubMed
    1. Ashburner J, Friston KJ ( 2000): Voxel‐based morphometry—The methods. Neuroimage 11: 805–821. - PubMed
    1. Bian L, Yang JD, Guo TW, Sun Y, Duan SW, Chen WY, Pan YX, Yeng GY, He L ( 2004): Insulin‐degrading enzyme and Alzheimer disease. Neurology 63: 241–245. - PubMed
    1. Braak H, Braak E ( 1991): Neuropathological stageing of Alzheimer‐related changes. Acta Neuropathol 82: 239–259. - PubMed

Publication types

MeSH terms