. 2009 Aug;119(8):2281-90.
doi: 10.1172/jci38879.

Neonatal NK cells target the mouse duct epithelium via Nkg2d and drive tissue-specific injury in experimental biliary atresia

Affiliations

Neonatal NK cells target the mouse duct epithelium via Nkg2d and drive tissue-specific injury in experimental biliary atresia

Pranavkumar Shivakumar et al. J Clin Invest. 2009 Aug.

Abstract

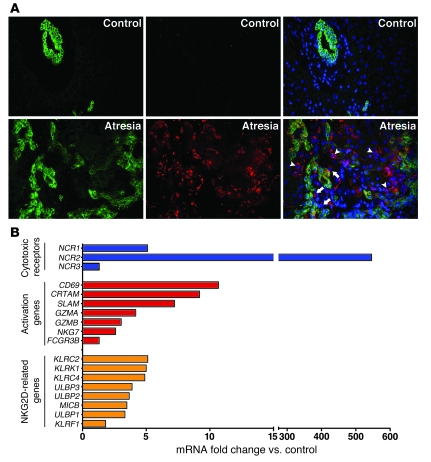
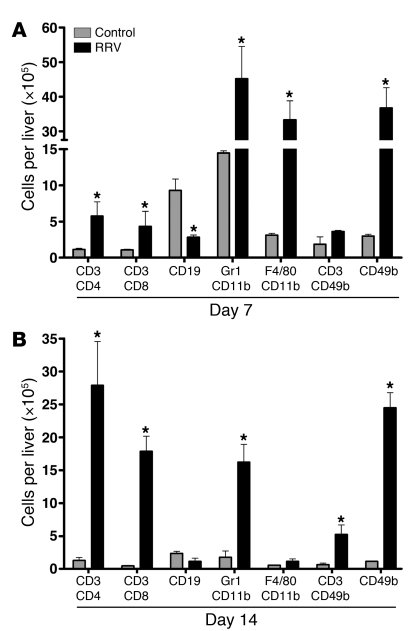
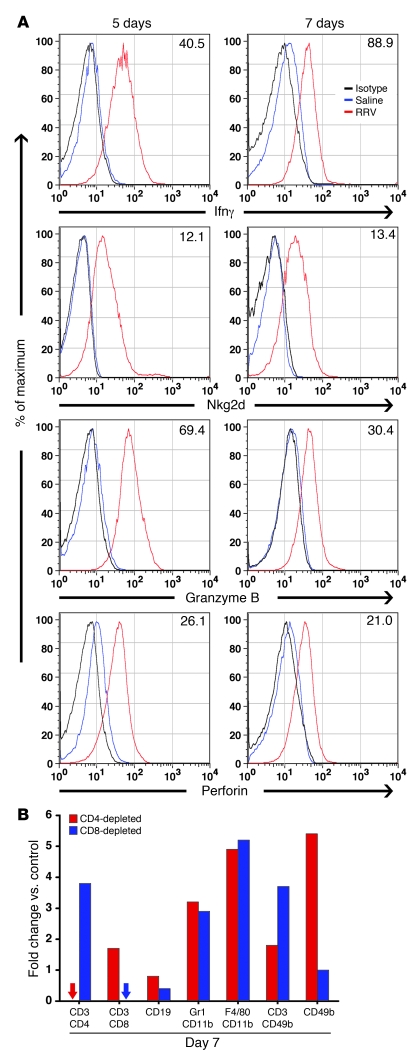
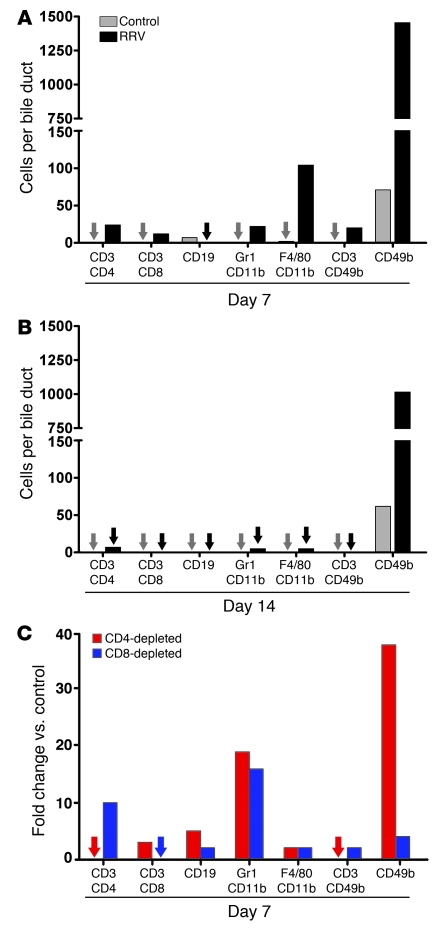
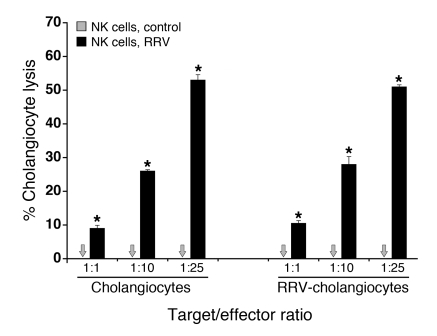
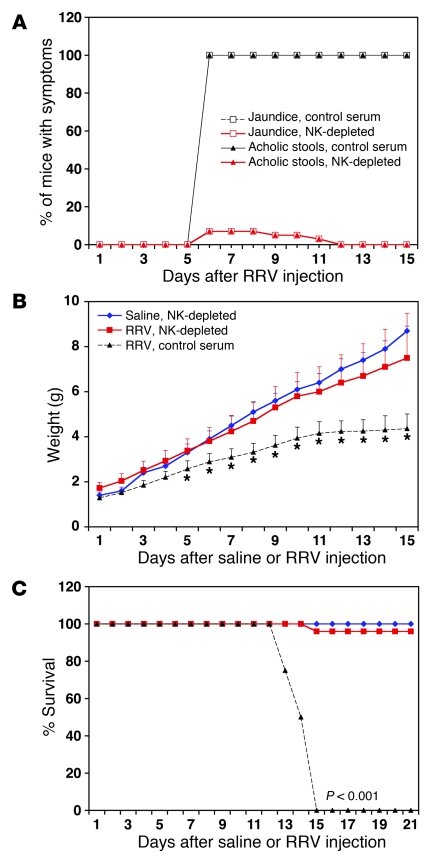
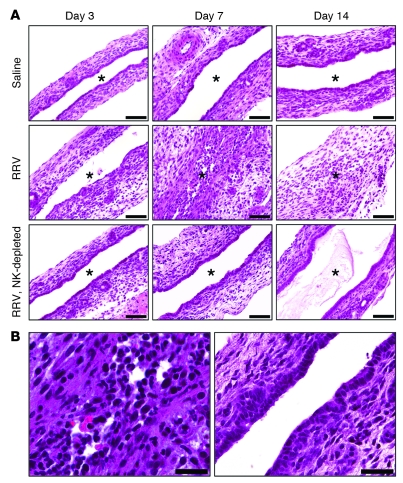
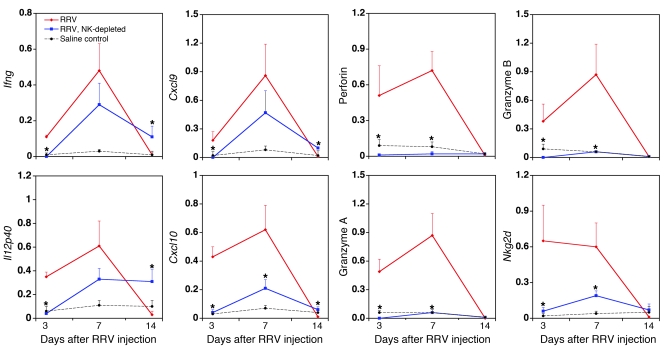
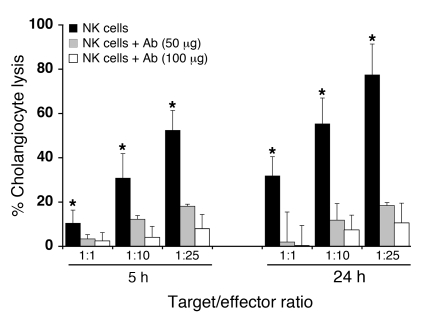
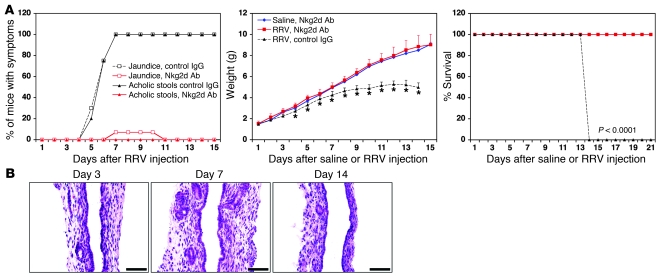
Biliary atresia is a neonatal obstructive cholangiopathy that progresses to end-stage liver disease. Although the etiology is unknown, a neonatal adaptive immune signature has been mechanistically linked to obstruction of the extrahepatic bile ducts. Here, we investigated the role of the innate immune response in the pathogenesis of biliary atresia. Analysis of livers of infants at diagnosis revealed that NK cells populate the vicinity of intrahepatic bile ducts and overexpress several genes involved in cytotoxicity. Using a model of rotavirus-induced biliary atresia in newborn mice, we found that activated NK cells also populated murine livers and were the most abundant cells in extrahepatic bile ducts at the time of obstruction. Rotavirus-primed hepatic NK cells lysed cholangiocytes in a contact- and Nkg2d-dependent fashion. Depletion of NK cells and blockade of Nkg2d each prevented injury of the duct epithelium after rotavirus infection, maintained continuity of duct lumen between the liver and duodenum, and enabled bile flow, despite the presence of virus in the tissue and the overexpression of proinflammatory cytokines. These findings identify NK cells as key initiators of cholangiocyte injury via Nkg2d and demonstrate that injury to the duct epithelium drives the phenotype of experimental biliary atresia.


Figures

Figure 1
Figure 1. Population and activation of NK cells in livers of infants with biliary atresia.
(A) Representative sections of livers from unaffected controls and from infants at the time of diagnosis of biliary atresia immunostained with anti-cytokeratin (to detect cholangiocytes; green, left panels) and anti-CD56 (to detect NK cells; red, middle panels) antibodies. Right panels represent overlays of left and middle panels after nuclear counterstaining with DAPI (blue). Arrowheads indicate NK cells in the portal tract; arrows indicate NK cells juxtaposed to cholangiocytes; original magnification, ×400. (B) mRNA fold change relative to controls for genes encoding cytotoxic receptors, activation markers, and NKG2D-related genes in livers of infants with biliary atresia. mRNA was quantified by real-time PCR and expressed as a ratio to human HPRT. n = 9 for biliary atresia and n = 7 for controls; fold changes for all genes, except for NCR3 and FCGR3B, are statistically significant (P < 0.05).
Figure 2
Figure 2. Population of neonatal livers by inflammatory cells after RRV challenge.
Flow cytometry–based quantification of hepatic mononuclear cells at 7 (A) and 14 (B) days after RRV or saline inoculation into 1-day-old mice. The vertical axes show the average number of cells per liver ± SD. n = 3–4 for each group and time point for all experiments; *P < 0.05, RRV versus saline (control) groups. The horizontal axes show the surface markers identifying specific cell types.
Figure 3
Figure 3. RRV-induced activation of hepatic NK cells after RRV challenge.
(A) Flow cytometry histograms showing the expression of Ifnγ, Nkg2d, granzyme B, and perforin by hepatic CD49b+ (NK) cells at 5 and 7 days after RRV or saline injection. For each individual cytokine/protease, the number represents the mean fluorescence intensity induced by RRV minus the median fluorescence intensity of the appropriate saline control. n = 3 livers per group per time point; % of maximum (vertical axis) represents a normalization of the number of events in specific quadrants of the flow cytometry grid. (B) Flow cytometric quantification of hepatic mononuclear cells is represented as fold changes in RRV-inoculated relative to saline-control mice that had been depleted of CD4+ or CD8+ cells (cells isolated at 7 days after injection of saline or RRV). n = 3–4 for each group; arrows indicate nondetectable cells; the horizontal axis shows the surface markers identifying specific cell types.
Figure 4
Figure 4. Population of the neonatal extrahepatic biliary tract by inflammatory cells after RRV challenge.
Flow cytometric quantification of mononuclear cells isolated from extrahepatic bile ducts/gallbladders microdissected en bloc at 7 (A) and 14 (B) days after saline or RRV injection into 1-day-old mice. The vertical axis shows the average number of cells per bile duct. (C) The number of cells per bile duct is shown as fold changes in RRV-inoculated relative to saline-control mice that had been depleted of CD4+ or CD8+ cells (cells isolated at 7 days after injection of saline or RRV). n = 15–20 mice per group and per time point for all experiments; arrows indicate nondetectable cells. The horizontal axis shows the surface markers identifying specific cell types.
Figure 5
Figure 5. Lysis of cholangiocytes by hepatic NK cells.
Mean (±SD) percentage of 51Cr release by the murine cholangiocyte line mCL after 5 hours of coculture with hepatic NK cells purified 7 days after saline injection or RRV inoculation into 1-day-old mice. The horizontal axis shows mCL (target) to NK (effector) cell ratios. n = 3 wells per group; results are representative of 2 independent experiments, with hepatic NK cells obtained from pools of 10–15 livers (*P < 0.01); arrows indicate nondetectable cells.
Figure 6
Figure 6. Improved outcome following RRV inoculation in NK cell–depleted mice.
Development of symptoms (A), weight gain (B), and survival (C) of neonatal mice after saline or RRV injection on the first day of life. Mice were also injected daily with NK cell–depleting serum or control serum. Saline, NK depleted: n = 10; RRV, NK depleted: n = 25; RRV, control serum: n = 16; *P < 0.001.
Figure 7
Figure 7. Prevention of bile duct injury and obstruction by NK cell depletion.
H&E staining of longitudinal sections of murine extrahepatic bile ducts at different time points after saline or RRV injection in the first day of life; the “RRV, NK depleted” group of mice was also injected daily with NK cell–depleting serum (A). (B) The photomicrograph on the left is a higher-magnification image of the middle panel in A showing the inflammatory obstruction of the duct lumen 7 days after RRV, while the photograph on the right shows the intact epithelium and unobstructed duct lumen 7 days after RRV infection of an NK cell–depleted mouse. Asterisks indicate the bile duct lumen. Scale bars: 50 μm.
Figure 8
Figure 8. Expression of cytokines and chemokines after RRV infection.
Hepatic mRNA expression for Ifng, Il12p40, Cxcl9, Cxcl10, perforin, granzymes A and B, and Nkg2d at 3, 7, and 14 days after RRV injection into BALB/c mice and into NK cell–depleted BALB/c mice. The baseline level of mRNA expression is shown in saline-injected controls as dashed black lines. n = 3–4 per group and per time point; *P < 0.05.
Figure 9
Figure 9. Block of cholangiocyte lysis by anti-Nkg2d antibodies.
Mean (±SD) percentage of 51Cr release by the murine cholangiocyte line mCL after 5 and 24 hours of coculture with hepatic NK cells purified 7 days after injection of RRV into 1-day-old mice. Hepatic NK cells were added directly to the culture or preincubated with 50 or 100 μg of blocking anti-Nkg2d antibodies before being added to the culture. The horizontal axis shows mCL (target) to NK (effector) cell ratios. n = 3 wells per group; results are representative of 2 independent experiments, with hepatic NK cells obtained from pools of 15–20 livers (*P < 0.01).
Figure 10
Figure 10. Improved outcome after blocking Nkg2d.
(A) Development of symptoms, weight gain, and survival after daily i.p. injections of 100 μg of anti-Nkg2d neutralizing antibodies (or IgG isotype control) into neonatal mice injected with saline or RRV on the first day of life. Saline, Nkg2d Ab: n = 8; RRV, Nkg2d Ab: n = 38; RRV, control IgG: n = 13. *P < 0.01. (B) H&E staining of representative longitudinal sections of murine extrahepatic bile ducts at different time points after injection of RRV on the first day of life, followed by the daily administration of 100 μg of blocking anti-Nkg2d antibodies. Scale bars: 50 μm.

Comment in

References

    1. Balistreri W.F., et al. Biliary atresia: current concepts and research directions. Summary of a symposium. Hepatology. 1996;23:1682–1692. doi: 10.1002/hep.510230652. - DOI - PubMed
    1. Mack C.L. The pathogenesis of biliary atresia: evidence for a virus-induced autoimmune disease. Semin. Liver Dis. 2007;27:233–242. doi: 10.1055/s-2007-985068. - DOI - PMC - PubMed
    1. Sokol R.J., et al. Screening and outcomes in biliary atresia: summary of a National Institutes of Health workshop. Hepatology. 2007;46:566–581. doi: 10.1002/hep.21790. - DOI - PMC - PubMed
    1. Bezerra J.A., et al. Genetic induction of proinflammatory immunity in children with biliary atresia. Lancet. 2002;360:1653–1659. - PubMed
    1. Mack C.L., et al. Oligoclonal expansions of CD4+ and CD8+ T-cells in the target organ of patients with biliary atresia. Gastroenterology. 2007;133:278–287. doi: 10.1053/j.gastro.2007.04.032. - DOI - PMC - PubMed

Publication types

MeSH terms

Substances