

Sequential dissociation of subunits from bovine heart cytochrome C oxidase by urea
- PMID: 19663452
- PMCID: PMC2745730
- DOI: 10.1021/bi900773r
Sequential dissociation of subunits from bovine heart cytochrome C oxidase by urea
Abstract
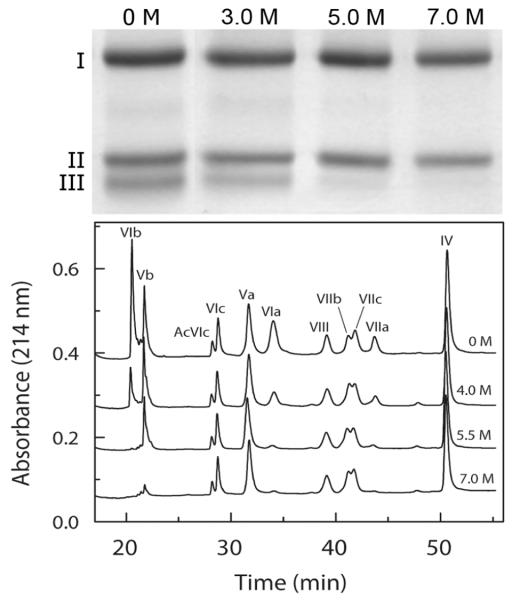
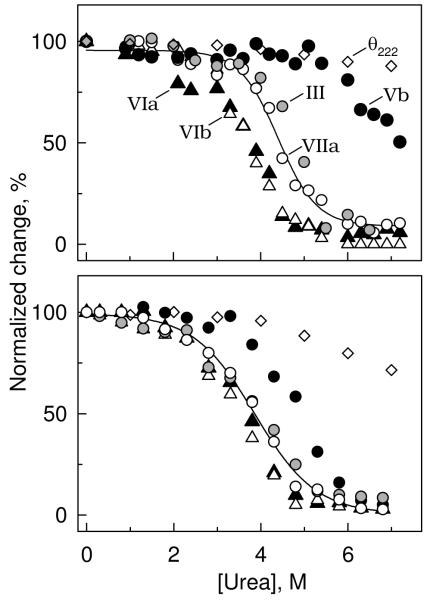
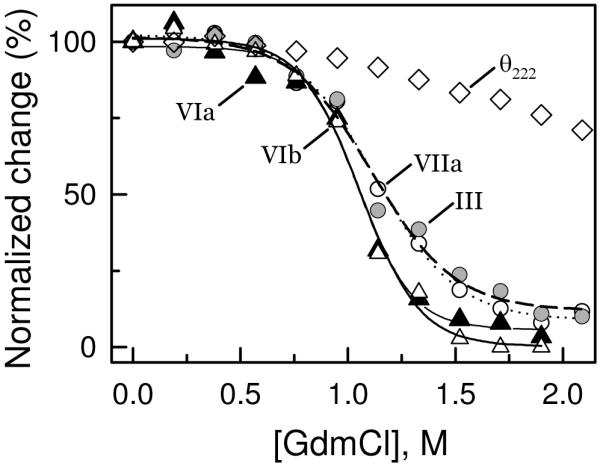
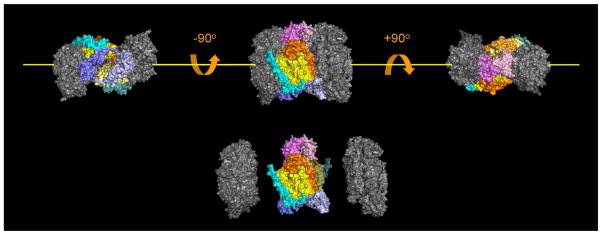
The quaternary stability of purified, detergent-solubilized, cytochrome c oxidase (CcO) was probed using two chemical denaturants, urea and guanidinium chloride (GdmCl). Each chaotrope induces dissociation of five subunits in a concentration-dependent manner. These five subunits are not scattered over the surface of CcO but are clustered together in close contact at the dimer interface. Increasing the concentration of urea selectively dissociates subunits from CcO in the following order: VIa and VIb, followed by III and VIIa, and finally Vb. After incubation in urea for 10 min at room temperature, the sigmoidal dissociation transitions were centered at 3.7, 4.6, and 7.0 M urea, respectively. The secondary structure of CcO was only minimally perturbed, indicating that urea causes disruption of subunit interactions without urea-induced conformational changes. Incubation of CcO in urea for 120 min produced similar results but shifted the sigmoidal dissociation curves to lower urea concentrations. Incubation of CcO with increasing concentrations of GdmCl produces an analogous effect; however, the GdmCl-induced dissociation of subunits occurs at lower concentrations and with a narrower concentration range. Thermodynamic parameters for each subunit dissociation were evaluated from the sigmoidal dissociation data by assuming a single transition from bound to dissociated subunit. The free energy change accompanying urea-induced dissociation of each subunit ranged from 18.0 to 29.7 kJ/mol, which corresponds to 0.32-0.59 kJ/mol per 100 A(2) of newly exposed solvent-accessible surface area. These values are 30-50-fold smaller than previously reported for the unfolding of soluble or membrane proteins.
Figures
Similar articles
-
The Interplay among Subunit Composition, Cardiolipin Content, and Aggregation State of Bovine Heart Cytochrome c Oxidase.Cells. 2020 Dec 3;9(12):2588. doi: 10.3390/cells9122588. Cells. 2020. PMID: 33287231 Free PMC article. Review.
-
The kinetic stability of cytochrome C oxidase: effect of bound phospholipid and dimerization.Biophys J. 2014 Dec 16;107(12):2941-2949. doi: 10.1016/j.bpj.2014.10.055. Biophys J. 2014. PMID: 25517159 Free PMC article.
-
Destabilization of the Quaternary Structure of Bovine Heart Cytochrome c Oxidase upon Removal of Tightly Bound Cardiolipin.Biochemistry. 2015 Sep 15;54(36):5569-77. doi: 10.1021/acs.biochem.5b00540. Epub 2015 Aug 31. Biochemistry. 2015. PMID: 26284624
-
Differential stability of dimeric and monomeric cytochrome c oxidase exposed to elevated hydrostatic pressure.Biochemistry. 2007 Jun 19;46(24):7146-52. doi: 10.1021/bi700548a. Epub 2007 May 26. Biochemistry. 2007. PMID: 17530783 Free PMC article.
-
Structural studies on bovine heart cytochrome c oxidase.Biochim Biophys Acta. 2012 Apr;1817(4):579-89. doi: 10.1016/j.bbabio.2011.12.012. Epub 2012 Jan 4. Biochim Biophys Acta. 2012. PMID: 22236806 Review.
Cited by
-
Dimer interface of bovine cytochrome c oxidase is influenced by local posttranslational modifications and lipid binding.Proc Natl Acad Sci U S A. 2016 Jul 19;113(29):8230-5. doi: 10.1073/pnas.1600354113. Epub 2016 Jun 30. Proc Natl Acad Sci U S A. 2016. PMID: 27364008 Free PMC article.
-
Delipidation of cytochrome c oxidase from Rhodobacter sphaeroides destabilizes its quaternary structure.Biochimie. 2016 Jun;125:23-31. doi: 10.1016/j.biochi.2016.02.013. Epub 2016 Feb 26. Biochimie. 2016. PMID: 26923069 Free PMC article.
-
The Interplay among Subunit Composition, Cardiolipin Content, and Aggregation State of Bovine Heart Cytochrome c Oxidase.Cells. 2020 Dec 3;9(12):2588. doi: 10.3390/cells9122588. Cells. 2020. PMID: 33287231 Free PMC article. Review.
-
The kinetic stability of cytochrome C oxidase: effect of bound phospholipid and dimerization.Biophys J. 2014 Dec 16;107(12):2941-2949. doi: 10.1016/j.bpj.2014.10.055. Biophys J. 2014. PMID: 25517159 Free PMC article.
-
Structural analysis of mitochondrial mutations reveals a role for bigenomic protein interactions in human disease.PLoS One. 2013 Jul 9;8(7):e69003. doi: 10.1371/journal.pone.0069003. Print 2013. PLoS One. 2013. PMID: 23874847 Free PMC article.
References
-
- Kadenbach B, Jarausch J, Hartmann R, Merle P. Separation of mammalian cytochrome c oxidase into 13 polypeptides by sodium dodecyl sulfate-gel electrophoresis procedure. Anal.Biochem. 1983;129:517–521. - PubMed
-
- Tsukihara T, Aoyama H, Yamashita E, Tomizaki T, Yamaguchi H, Shinzawa-Itoh K, Nakashima R, Yaono R, Yoshikawa S. The whole structure of the 13-subunit oxidized cytochrome c oxidase at 2.8 Å. Science. 1996;272:1136–1144. - PubMed
-
- Hosler JP, Fetter J, Tecklenburg MM, Espe M, Lerma C, Ferguson-Miller S. Cytochrome aa3 of Rhodobacter sphaeroides as a model for mitochondrial cytochrome c oxidase. Purification, kinetics, proton pumping, and spectral analysis. J. Biol. Chem. 1992;267:24264–24272. - PubMed
-
- Abramson J, Svensson-Ek M, Byrne B, Iwata S. Structure of cytochrome c oxidase: a comparison of the bacterial and mitochondrial enzymes. Biochim. Biophys. Acta. 2001;1544:1–9. - PubMed
-
- Svensson-Ek M, Abramson J, Larsson G, Törnroth S, Brzezinski P, Iwata S. The X-ray crystal structures of wild-type and EQ(I-286) mutant cytochrome c oxidases from Rhodobacter sphaeroides. J. Mol. Biol. 2002;321:329–339. - PubMed
Publication types
MeSH terms
Substances
Grants and funding
LinkOut - more resources
Full Text Sources
