. 2009 Sep 29;48(38):9094-102.
doi: 10.1021/bi901092z.

Trapping an intermediate of dinitrogen (N2) reduction on nitrogenase

Affiliations

Trapping an intermediate of dinitrogen (N2) reduction on nitrogenase

Brett M Barney et al. Biochemistry. .

Abstract

Nitrogenase reduces dinitrogen (N2) by six electrons and six protons at an active-site metallocluster called FeMo cofactor, to yield two ammonia molecules. Insights into the mechanism of substrate reduction by nitrogenase have come from recent successes in trapping and characterizing intermediates generated during the reduction of protons as well as nitrogenous and alkyne substrates by MoFe proteins with amino acid substitutions. Here, we describe an intermediate generated at a high concentration during reduction of the natural nitrogenase substrate, N2, by wild-type MoFe protein, providing evidence that it contains N2 bound to the active-site FeMo cofactor. When MoFe protein was frozen at 77 K during steady-state turnover with N2, the S = 3/2 EPR signal (g = [4.3, 3.64, 2.00]) arising from the resting state of FeMo cofactor was observed to convert to a rhombic, S = 1/2, signal (g = [2.08, 1.99, 1.97]). The intensity of the N2-dependent EPR signal increased with increasing N2 partial pressure, reaching a maximum intensity of approximately 20% of that of the original FeMo cofactor signal at > or = 0.2 atm N2. An almost complete loss of resting FeMo cofactor signal in this sample implies that the remainder of the enzyme has been reduced to an EPR-silent intermediate state. The N2-dependent EPR signal intensity also varied with the ratio of Fe protein to MoFe protein (electron flux through nitrogenase), with the maximum signal intensity observed with a ratio of 2:1 (1:1 Fe protein:FeMo cofactor) or higher. The pH optimum for the signal was 7.1. The N2-dependent EPR signal intensity exhibited a linear dependence on the square root of the EPR microwave power in contrast to the nonlinear response of signal intensity observed for hydrazine-, diazene-, and methyldiazene-trapped states. 15N ENDOR spectroscopic analysis of MoFe protein captured during turnover with 15N2 revealed a 15N nuclear spin coupled to the FeMo cofactor with a hyperfine tensor A = [0.9, 1.4, 0.45] MHz establishing that an N2-derived species was trapped on the FeMo cofactor. The observation of a single type of 15N-coupled nucleus from the field dependence, along with the absence of an associated exchangeable 1H ENDOR signal, is consistent with an N2 molecule bound end-on to the FeMo cofactor.


Figures

Figure 1
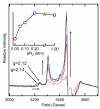
Figure 1. X-band EPR spectra of nitrogenase
(Panel A) Shown is the X-band EPR spectrum for the resting state of the MoFe protein (Resting) and of the MoFe protein trapped by freezing to 77 K during turnover under 1 atm of N2 (N2 turnover). (Panel B) The g ~ 2 region of the N2 turnover trapped state. The concentration of MoFe protein is 50 μM. Turnover conditions are described in the Materials and Methods and include 50 μM Fe protein. The EPR microwave power was 1.0 mW, the temperature was 4.8 K, and the modulation frequency was 1.26 mT. Each trace is the sum of 5 scans.
Figure 2
Figure 2. Dependence of EPR signal intensity on pH
Shown are the relative intensities of the EPR signals for the turnover trapped states with N2 (●), diazene (◇), hydrazine (▵), and methyldiazene (◻) as substrates. The EPR microwave power was 1.0 mW and the temperature was 5.2 K. All other conditions are noted in the Materials and Methods section.
Figure 3
Figure 3. Dependence of EPR signal intensity on partial pressure of N2
EPR spectra (g ~ 2 region) are shown of the MoFe protein trapped during turnover under different partial pressures of N2 including 0 (red), 0.05 (green), 0.1 (magenta), 0.2 (blue), and 1 (black) atm. The inset shows the relative intensity of the g = 1.99 EPR signal as a function of partial pressure of N2. The EPR microwave power was 1.0 mW and the temperature was 4.9 K. Other conditions are described in the Materials and Methods section.
Figure 4
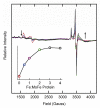
Figure 4. Dependence of EPR signal intensity on the electron flux through nitrogenase
EPR spectra (g ~ 2 region) are shown for nitrogenase trapped during turnover of N2 with different ratios of Fe protein:MoFe protein including 0:1 (red), 0.5:1 (blue), 1:1 (magenta), 2:1 (green), 3:1 (black), and 4:1 (black). The inset shows the relative intensity of the g = 1.99 EPR signal as a function of the Fe protein: MoFe protein ratio. The EPR microwave power was 1.0 mW and the temperature was 5.2 K. Other conditions are described in the Materials and Methods section.
Figure 5
Figure 5. Electron flux control of nitrogenase
(Panel A) The specific activity for ammonia formation (nmol NH3 formed/min/mg of MoFe protein) under 1 atm of N2 is shown as a function of the Fe protein:MoFe protein ratio. (Panel B) The specific activity for H2 formation (nmol H2 formed/min/mg MoFe protein) under 1 atm of argon (○) or under 1 atm of N2 (▵) is shown as a function of Fe protein:MoFe protein ratio. Assay conditions are described in the Materials and Methods section.
Figure 6
Figure 6. Dependence of trapped state EPR signal intensity on the square root of the microwave power
Shown are the relative intensities of the EPR signals for the resting state (▴) or the turnover trapped states with hydrazine (○), diazene (▿), methyldiazene (▵), or N2 (◆) as substrate plotted against the square root of the microwave power. Conditions are described in the Materials and Methods section.
Figure 7
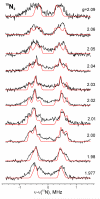
Figure 7. The field dependence of 15N Mims ENDOR for 15N2-derived intermediate in wild-type MoFe protein
Conditions: microwave frequency, 34.84 GHz; Mims sequence, π/2 = 50 ns, τ = 500ns; RF 40 μs; repetition time, 10 ms; ~ 1000-3000 transients/point; temperature, 2K. Spectral baselines were corrected by simple subtraction if needed. Simulation (red) parameters: g = [2.08, 1.99, 1.97]; hyperfine tensor A = [0.9, 1.4, 0.45] MHz, Euler angles α=45°, β=55°, γ=0° with respect to g-frame.
Figure 8
Figure 8. τ dependence of ENDOR spectra collected at g3 for 15N2 intermediate in wild-type MoFe protein
The triangles represent the Mims “blind spots”. Conditions: microwave frequency, 34.828 GHz; Mims sequence, π/2 = 50 ns; RF 40 μs; repetition time, 10 ms; 1000-2000 transients/point; temperature, 2K.
Figure 9
Figure 9. The field dependence of CW 1H ENDOR
Shown are the 1H CW ENDOR and 2H Mims ENDOR spectra for wild-type MoFe protein trapped during turnover with N2 in H2O (black) and D2O (red and blue) buffers. Conditions: CW ENDOR, microwave frequency, 35.096GHz (H2O), 35.083 GHz (D2O); modulation amplitude, 2 G; time constant, 32 ms; RF sweep speed, 1 MHz/sec; bandwidth of RF broadened to 100 kHz; temperature, 2K; Mims sequence, microwave frequency, 34.834 GHz; π/2 = 50 ns, τ = 500 ns; RF 40 μs; repetition time, 20 ms; 100-200 transient/point; temperature, 2K.

References

    1. Burgess BK, Lowe DJ. The mechanism of molybdenum nitrogenase. Chem. Rev. 1996;96:2983–3011. - PubMed
    1. Seefeldt LC, Hoffman BM, Dean DR. Mechanism of Mo-dependent nitrogenase. Annu. Rev. Biochem. 2009;78:701–722. - PMC - PubMed
    1. Hoffman BM, Dean DR, Seefeldt LC. Climbing nitrogenase: toward a mechanism of enzymatic nitrogen fixation. Acc. Chem. Res. 2009;42:609–619. - PMC - PubMed
    1. Rees DC, Tezcan FA, Haynes CA, Walton MY, Andrade S, Einsle O, Howard JB. Structural basis of biological nitrogen fixation. Phil. Trans. R. Soc. A. 2005;363:971–984. - PubMed
    1. Shah VK, Brill WJ. Isolation of an iron-molybdenum cofactor from nitrogenase. Proc. Natl. Acad. Sci. U.S.A. 1977;74:3249–3253. - PMC - PubMed

Publication types