. 2009 Aug 7:10:369.
doi: 10.1186/1471-2164-10-369.

The adult boar testicular and epididymal transcriptomes

Affiliations

The adult boar testicular and epididymal transcriptomes

Benoît Guyonnet et al. BMC Genomics. .

Abstract

Background: Mammalians gamete production takes place in the testis but when they exit this organ, although spermatozoa have acquired a specialized and distinct morphology, they are immotile and infertile. It is only after their travel in the epididymis that sperm gain their motility and fertility. Epididymis is a crescent shaped organ adjacent to the testis that can be divided in three gross morphological regions, head (caput), body (corpus) and tail (cauda). It contains a long and unique convoluted tubule connected to the testis via the efferent ducts and finished by joining the vas deferens in its caudal part.

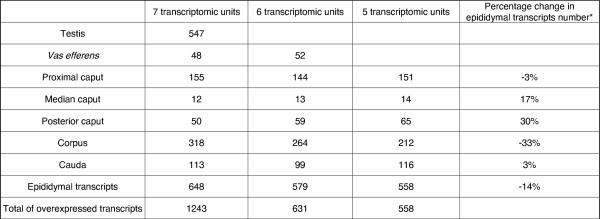
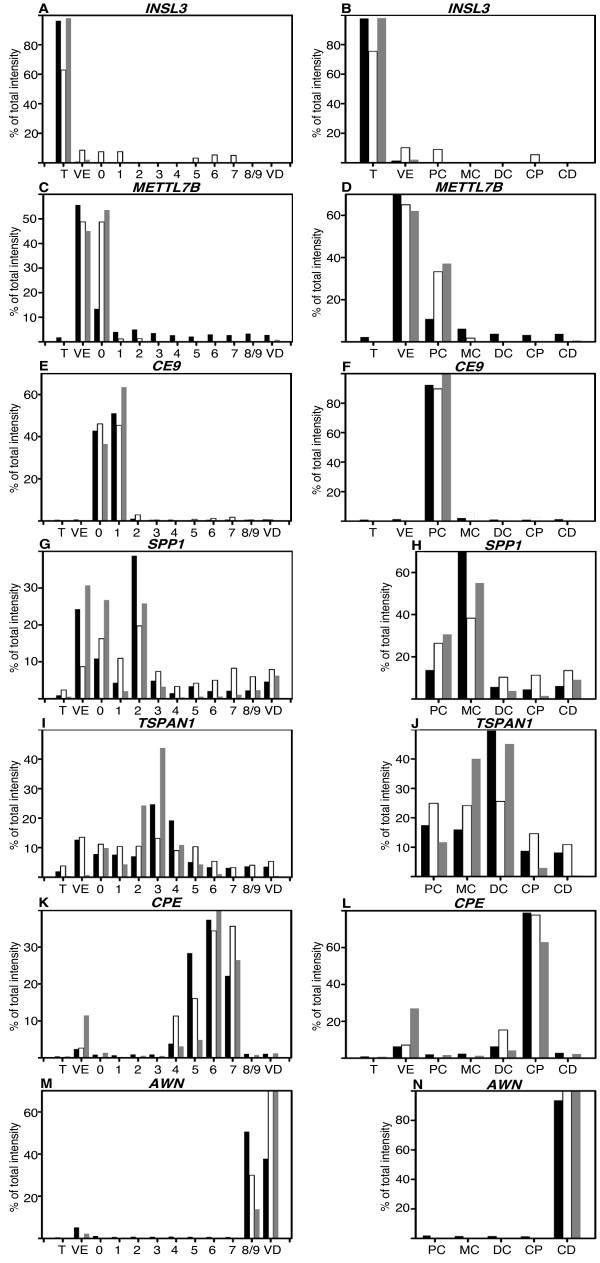
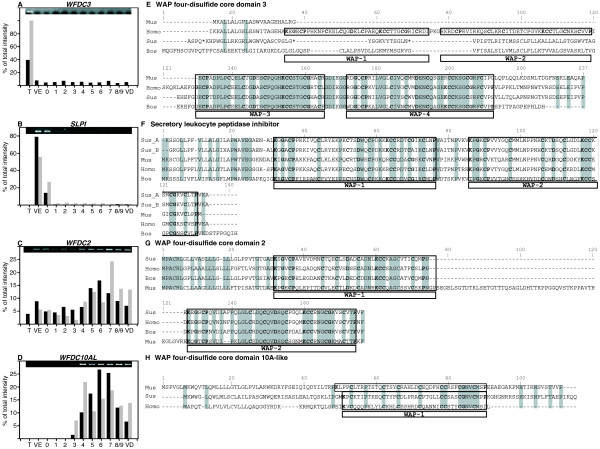
Results: In this study, the testis, the efferent ducts (vas efferens, VE), nine distinct successive epididymal segments and the deferent duct (vas deferens, VD) of four adult boars of known fertility were isolated and their mRNA extracted. The gene expression of each of these samples was analyzed using a pig generic 9 K nylon microarray (AGENAE program; GEO accession number: GPL3729) spotted with 8931 clones derived from normalized cDNA banks from different pig tissues including testis and epididymis. Differentially expressed transcripts were obtained with moderated t-tests and F-tests and two data clustering algorithms based either on partitioning around medoid (top down PAM) or hierarchical clustering (bottom up HCL) were combined for class discovery and gene expression analysis. Tissue clustering defined seven transcriptomic units: testis, vas efferens and five epididymal transcriptomic units. Meanwhile transcripts formed only four clusters related to the tissues. We have then used a specific statistical method to sort out genes specifically over-expressed (markers) in testis, VE or in each of the five transcriptomic units of the epididymis (including VD). The specific regional expression of some of these genes was further validated by PCR and Q-PCR. We also searched for specific pathways and functions using available gene ontology information.

Conclusion: This study described for the first time the complete transcriptomes of the testis, the epididymis, the vas efferens and the vas deferens on the same species. It described new genes or genes not yet reported over-expressed in these boar tissues, as well as new control mechanisms. It emphasizes and fulfilled the gap between studies done in rodents and human, and provides tools that will be useful for further studies on the biochemical processes responsible for the formation and maintain of the epididymal regionalization and the development of a fertile spermatozoa.


Figures

Figure 1
Figure 1
Boar epididymis. Picture of the boar epididymis showing the different regions sampled: VE, vas efferens; 0 to 8/9, epididymis; VD, vas deferens. Reel size, 30 cm.
Figure 2
Figure 2
Statistical analysis. A) PAM outcome: the graph shows the mean width of clusters depending on the number of zones included in the cluster. B) Silhouette width (clustering score) of each of the seven transcriptomic units chosen for the clustering using the best second score of the PAM algorithm. C) Dendrogram obtained for the clustering of the 12 zones by HAC algorithm. The blue line cuts the dendrogram to retrieve the 7 transcriptomic units. D) Graph of PAM outcome showing the mean width of clusters depending on the number of clusters for transcripts. E) Clustering score (silhouette width) obtained for transcripts corresponding to the second best score of the PAM. F) Heat map representation of the transcripts clustering obtained by HCL algorithm. The blue line at the top cuts the dendrogram to show the 7 transcriptomic units and the green line on the left cuts the dendrogram to retrieve the 4 clusters of transcripts. (Relative expression level: yellow = high, blue = low; white = missing values). T: Testis, VE: Vas efferens, E0 to E8/9: nine epididymal zones, PC: Proximal caput, MC: Median caput, DC: Distal caput, VD: Vas deferens.
Figure 3
Figure 3
Over-expressed transcripts. Number of over-expressed transcripts in an unique transcriptomic unit for each of the 7 transcriptomic units found by the clustering analysis (BH = 1/100 000). Analysis was done with all transcriptomic units (7 units), without testis (6 units) and without testis and vas efferens (5 epididymal units). *compared results obtained with 5 versus 7 transcriptomic units.
Figure 4
Figure 4
RT-PCR amplifications. RT-PCR amplifications of some transcripts differentially expressed or control (ie, not differential) between the 12 or 10 zones studied. T: Testis, VE: Vas efferens, PC: Proximal caput (E0-1), MC: Median caput (E2), DC: Distal caput (E3-4), Corpus (E4-7), Cauda (E8/9 and Vas deferens (VD)), (-): negative PCR controls. The table on right indicated the number of PCR cycles used and the cluster in which the transcript belongs by the clustering analysis using 12 or 10 zones. NC: transcripts were not classified in an identical manner by the two methods (PAM and HCL), NA: transcripts were not statistically differentially expressed. INSL3 (insulin-like 3), INHA (inhibin, alpha), CLU (clusterin), METTL7B (methyltransferase like 7B), RARRES2 (retinoic acid receptor responder (tazarotene induced) 2), TEDDM1 (Transmembrane epididymal protein 1), SPP1 (secreted phosphoprotein 1), TSPAN1 (tetraspanin 1), GPX5 (glutathione peroxidase 5 (epididymal androgen-related protein)), HEXA (hexosaminidase A (alpha polypeptide)), RAP1A (RAP1A, member of RAS oncogene family), CPE (carboxypeptidase E), CES7 (carboxylesterase 7), MAN2B2 (mannosidase, alpha, class 2B, member 2), MUC1 (mucin 1, cell surface associated), AWN (sperm associated AWN protein), CRABP1 (cellular retinoic acid binding protein 1), RERG (RAS-like, estrogen-regulated, growth inhibitor), APLP2 (amyloid beta (A4) precursor-like protein 2), B2M (beta-2-microglobulin).
Figure 5
Figure 5
Comparison of relative expression of selected transcripts on microarray, PCR and realtime PCR. A-C-E-G-I-K-M: Relative expression of selected transcripts obtained from microarray, PCR (from Figure 4) and realtime PCR. Each value is expressed as a percent of the total intensity measured in the 12 samples studied (see materials and methods). In black, microarray values (each data is the mean of the data from the 4 boars studied), in white RT-PCR values and in grey Q-PCR values (values were obtained from one of the boar used in the microarray study). T: Testis, VE: Vas efferens, 0 to 8/9: nine epididymal zones, VD: Vas deferens. B-D-F-H-J-L-N: Relative expression measured in the 12 samples studied were averaged to reproduce either the 7 or 5 transcriptomic units for which some transcripts have been defined as markers. Microarray, RT-PCR and Q-PCR values are in black, white and grey respectively (T: Testis, VE: Vas efferens, PC: Proximal caput (E0-1), MC: Median caput (E2), DC: Distal caput (E3-4), CP: Corpus (E5-6-7), CD: Cauda (E8/9-Vas deferens).
Figure 6
Figure 6
Lipocalins expression. A to H: Relative expression of the different lipocalins studied: APOD (apolipoprotein D), PTGDS (prostaglandin D2 synthase), UCAL-P19 (uterocalin), LCN5 (lipocalin 5), LCN6 (lipocalin 6), LCN8 (lipocalin 8), UNQ2541 (uncharacterized lipocalin UNQ2541/PRO6093 precursor),LCN2 (lipocalin 2). On the top of each graphic the image of agarose gel used for amplicon quantifications is shown. In black, microarray values (means of the data from the 4 boars studied) and in grey RT-PCR values. T: Testis; VE: Vas efferens; 0 to 8/9: nine epididymal zones; VD: Vas deferens. Values represent the percent of total intensity measured in the 12 samples studied (see materials and methods).
Figure 7
Figure 7
Relative expression of defensins. A to G: Relative expression of DEFB109 (defensin beta 109), SPAG11B_C (sperm associated antigen 11B isoform C), DEFB121 (defensin beta 121), DEFB111 (defensin beta 111), DEFB113 (defensin beta 113), SPAG11B_E (sperm associated antigen 11B isoform E), DEFB129 (defensin beta 129) is represented as the percent of total intensity obtained on microarray (black) and for some compare with the percent of total amplicon intensity measured on the 12 samples studied (Grey). T: Testis, VE: Vas efferens, 0 to 8/9: nine epididymal zones, VD: Vas deferens. H to N: Comparison of the pig deduced amino acid sequences of each beta-defensin from different mammalian species. Amino acid residues that are identical between at least two sequences in alignments are placed in shaded boxes. Cysteins of the beta-defensin domain are in bold and for each protein, numbers of amino acids between the characteristic cysteins are reported in boxes. Hyphens represent gaps introduced for optimal alignment. O: Accession number of sequences used for alignments.
Figure 8
Figure 8
Protease inhibitors expression. A to D: Relative expression of WFDC3 (WAP four-disulfide core domain 3), SLPI (secretory leucocyte peptidase inhibitor), WFDC2 (WAP four-disulfide core domain 2), UNQWAP (uncharacterised WAP four-disulfide core domain protein) is represented as the percent of total intensity measured in the 12 samples studied by microarray in black and by RT-PCR values (grey). T: Testis, VE: Vas efferens, 0 to 8/9: nine epididymal zones, VD: Vas deferens). On the top the image of the agarose gel used for quantification. E to H: Comparison of the amino acid sequences of deduced Whey Acidic Protein family from different mammalian species. Identical Amino acid residues between at least two sequences in alignments are placed in shaded boxes. Characteristic domains are boxed and residues of the WAP domain are in bold. Hyphens represent gaps introduced for optimal alignment. Accession number of sequences used for alignments are: E: Mus (NP_082237), Homo (CAC36106), Sus (unpublished), Bos (XP_001789331); F: Sus_A (translated from scac0031.l.24), Sus_B (P22298), Mus (NP_035544), Homo (NP_003055), Bos (XP_590087); G: Sus (NP_999112), Homo(NP_006094), Bos (NP_001069958), Mus (NP_080599) and H: Mus (NP_001012741), Sus (translated from BX915529), Homo (NP_542791).
Figure 9
Figure 9
Gene variant analysis. A to D: Relative expression of CST11 (Cystatin 11 alternate transcript 1), CST11_Δ (Cystatin 11 alternate transcript 2), Eg627821 (predicted gene, EG627821 alternate transcript 1),Eg627821_Δ (predicted gene, EG627821 alternate transcript 2) is represented as the % of total amplicon intensity (grey) and corrected microarray values (black) measured in the 12 samples studied. T: Testis, VE: Vas efferens, 0 to 8/9: nine epididymal zones, VD: Vas deferens). On the top: image of agarose gels used for quantification. E: Comparison of nucleotidic sequences of Sus Scrofa CST11 alternate transcripts showing the primer positions used for amplification. Hyphens represent gaps introduced for optimal alignment. Numbers are residue numbers. Accession numbers for CST11 and CST11 Δ are respectively scac0028.a.13 and scac0036.l.15. F: Amino-acid sequences comparison between Sus Scrofa and Homo Sapiens CST11 isoforms showing that they have a different deletions. Amino acid residues that are identical between human and pig are shaded. Residues shown to belong to the cystatin domain by Pfam analyses are boxed and those characteristics of this domain are in bold. Accession numbers for hCST11, hCST11Δ are respectively NP_570612 and NP_543020. Amino acid sequences for sCST11 and sCST11_Δ are deduced from scac0028.a.13 and scac0036.l.15 respectively. Hyphens represent gaps introduced for optimal alignment. G: Comparison of nucleotide acid sequences of Sus Scrofa Eg627821 alternate transcripts showing that both sequence have a different deletion. Arrows show the hybridization site of primers used for amplification. Accession numbers for Eg627821 and Eg627821_Δ are respectively BX924253 and BX922624. Hyphens represent gaps introduced for optimal alignment.
Figure 10
Figure 10
New genes in boar testis and epididymis. A to F: Relative expression of SPINK5L2 (Kazal type serine protease inhibitor 5-like 2), MON1B (MON1 homolog B), FXYD2 (FXYD domain containing ion transport regulator 2),GP2 (glycoprotein 2), MUC15 (mucin 15),GLB1L3 (galactosidase, beta 1-like 3) is represented as the % of total RT-PCR amplicon intensity (grey) measured in the 12 samples studied (T: Testis, VE: Vas efferens, 0 to 8/9: nine epididymal zones, VD: Vas deferens) and compare with the normalized microarray intensity values (black). On the top of the graphic the image of agarose gel used for quantification.
Figure 11
Figure 11
Gene ontology terms enrichment. For each clustering analysis, GO terms enriched in one of the 4 or 3 clusters of transcripts are given. Terms that are common of the 2 clustering analyses are shaded. For muscle development and coated pit terms, the unit where the most genes encode for these terms is noticed in exponent.

Similar articles

Cited by

References

    1. Dacheux JL, Paquignon M. Relations between the fertilizing ability, motility and metabolism of epididymal spermatozoa. Reproduction, nutrition, development. 1980;20:1085–1099. - PubMed
    1. Robaire B, Hinton BT, Orgebin-Crist MC. The epididymis. In: JN K, editor. Physiology of reproduction. New York: Elsevier; 2006. pp. 1071–1148.
    1. Turner TT. Resorption versus secretion in the rat epididymis. J Reprod Fertil. 1984;72:509–514. - PubMed
    1. Turner TT. De Graaf's Thread: The Human Epididymis. J Androl. 2008;29:237–250. - PubMed
    1. Dacheux JL, Castella S, Gatti JL, Dacheux F. Epididymal cell secretory activities and the role of proteins in boar sperm maturation. Theriogenology. 2005;63:319–341. - PubMed

Publication types