. 2009 Dec 1;382(1-2):222-33.
doi: 10.1016/j.ijpharm.2009.07.030. Epub 2009 Aug 5.

Liposomal delivery of doxorubicin to hepatocytes in vivo by targeting heparan sulfate

Affiliations

Liposomal delivery of doxorubicin to hepatocytes in vivo by targeting heparan sulfate

Kenneth J Longmuir et al. Int J Pharm. .

Abstract

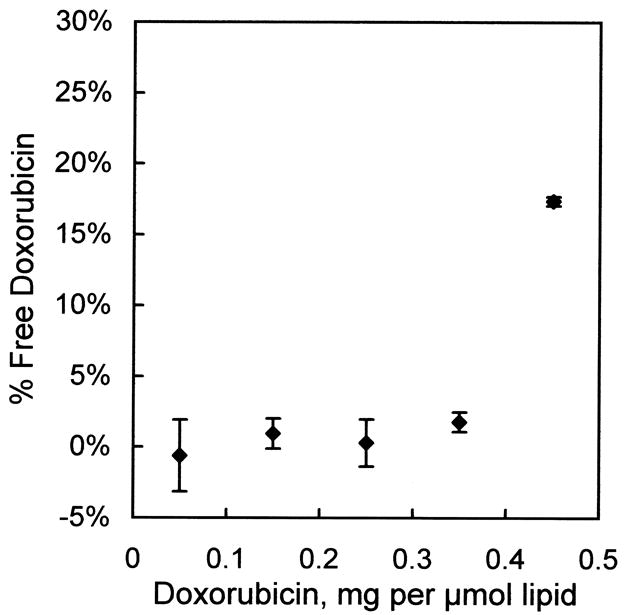
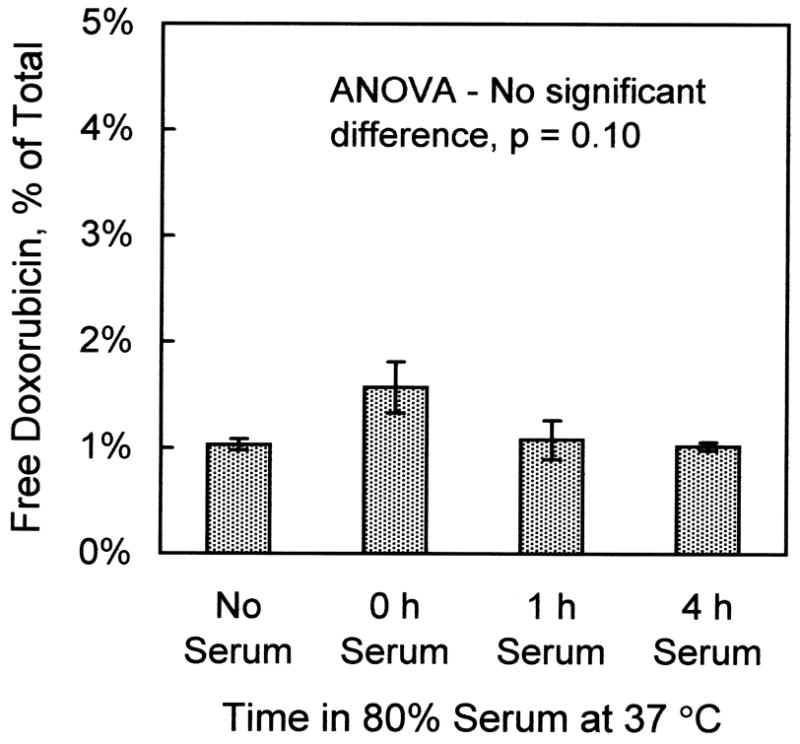
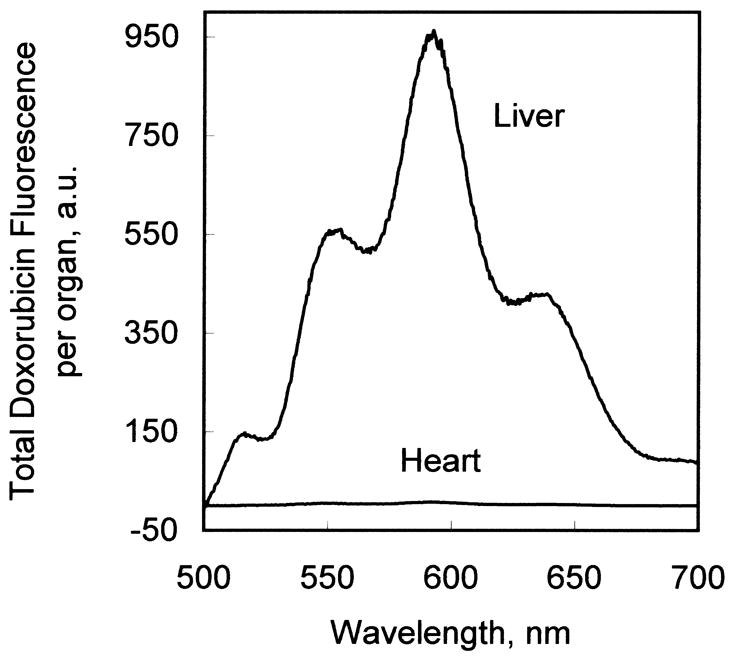
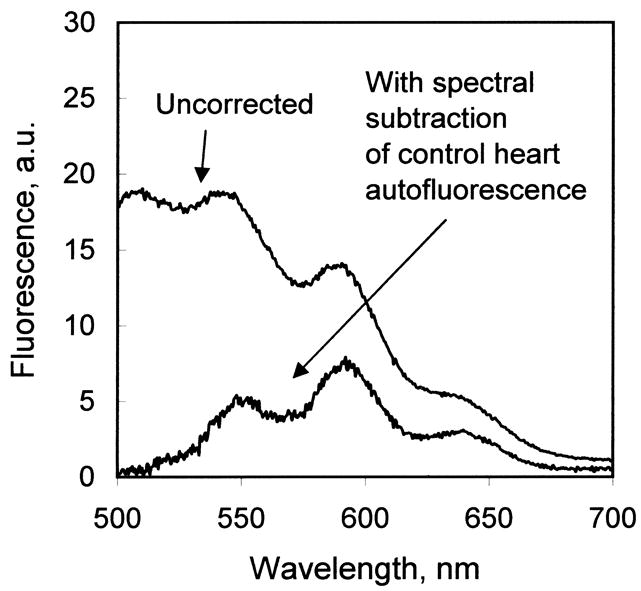
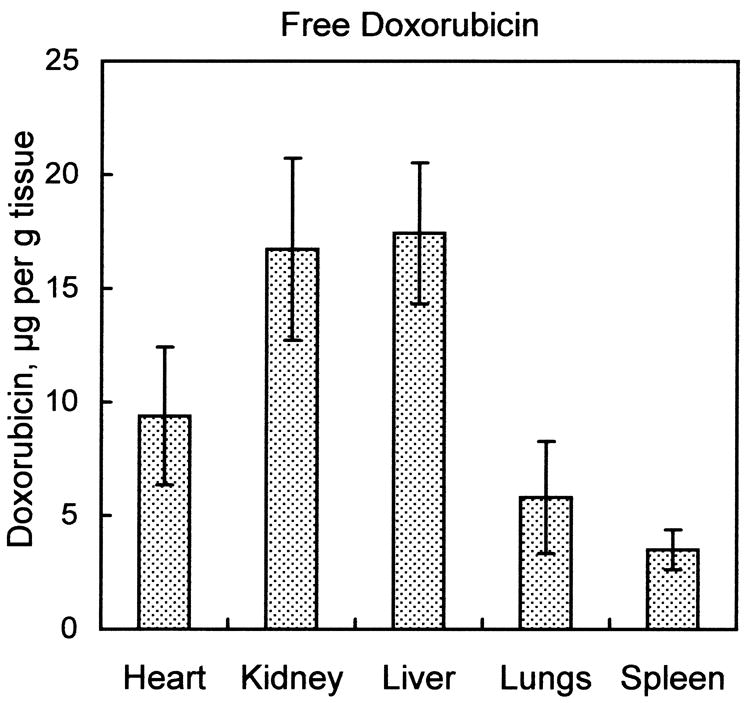
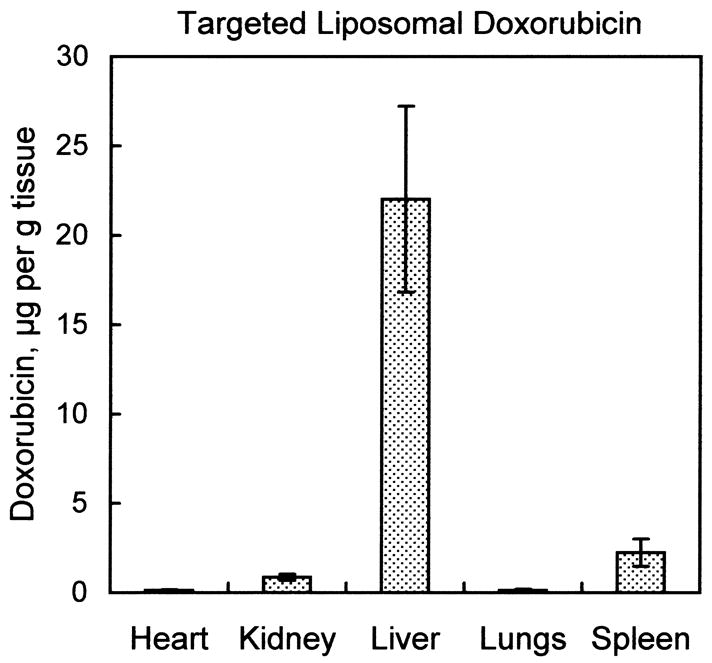
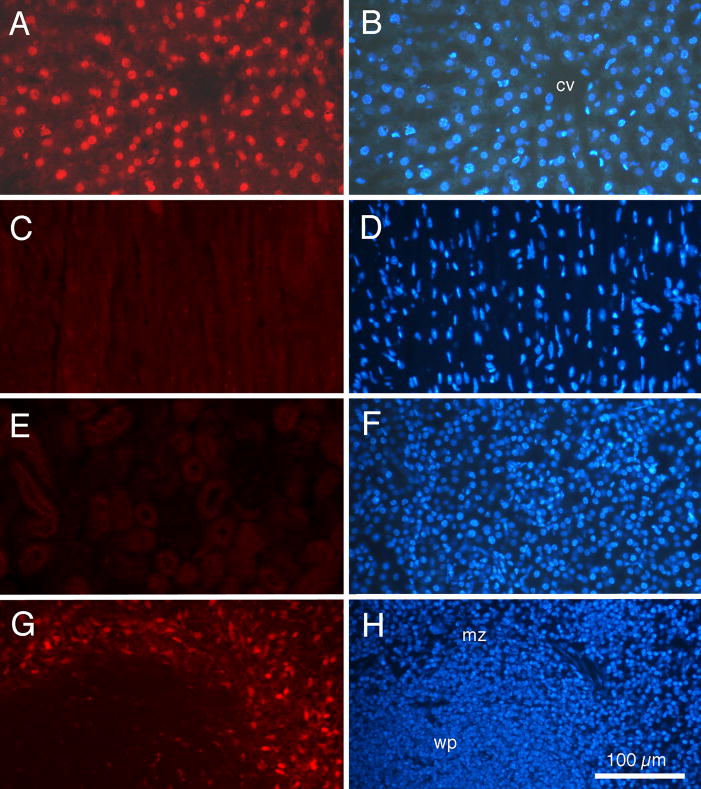
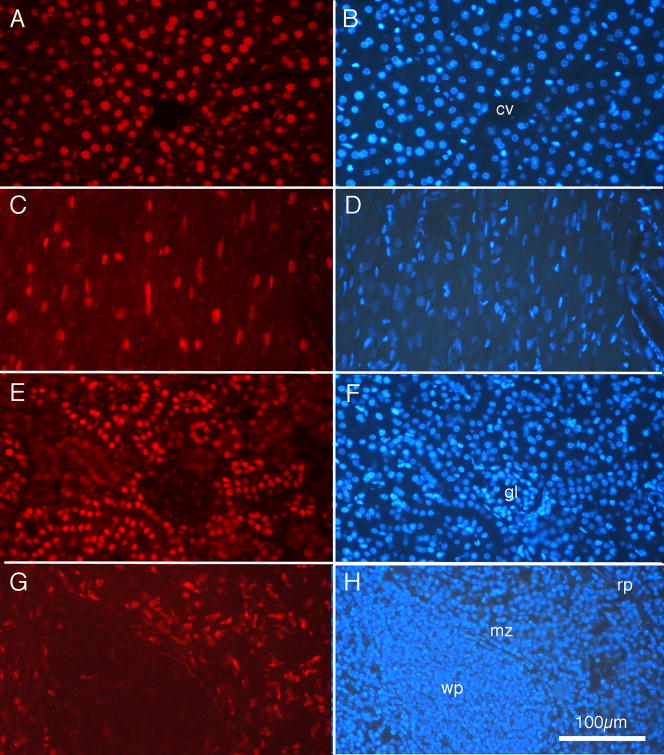
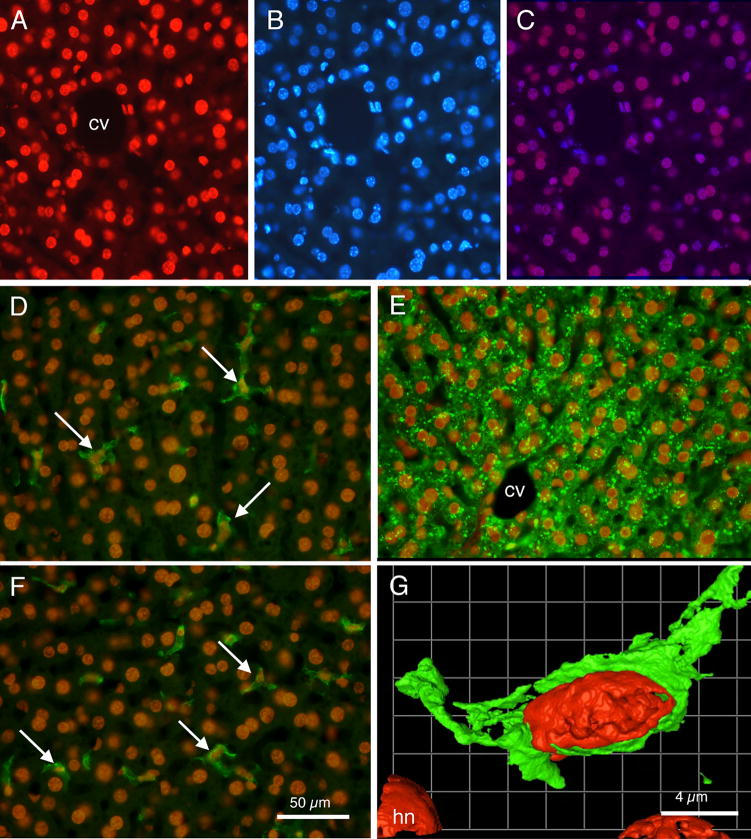
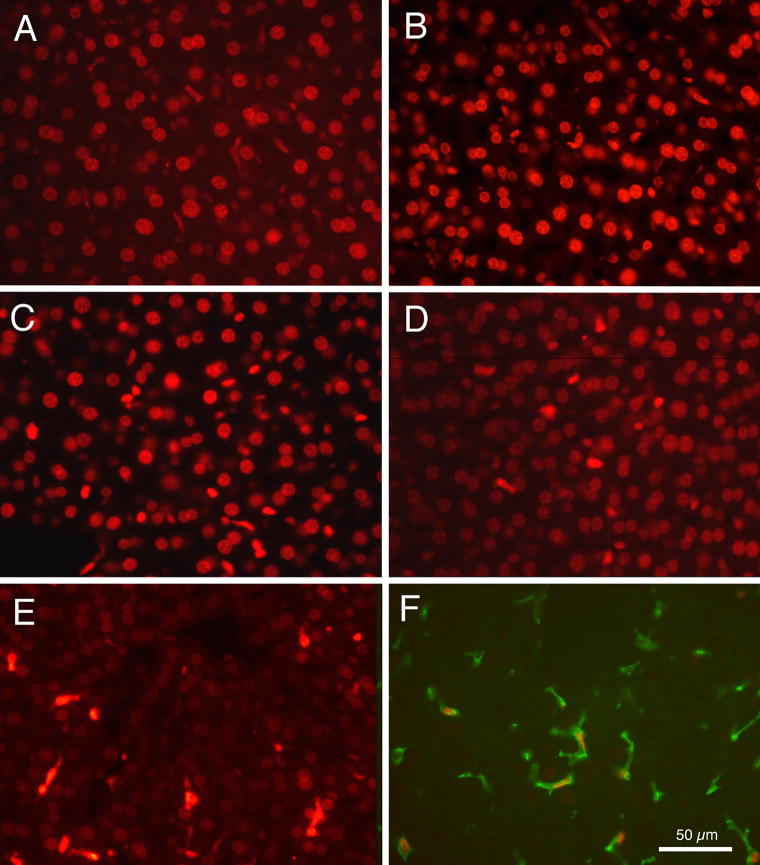
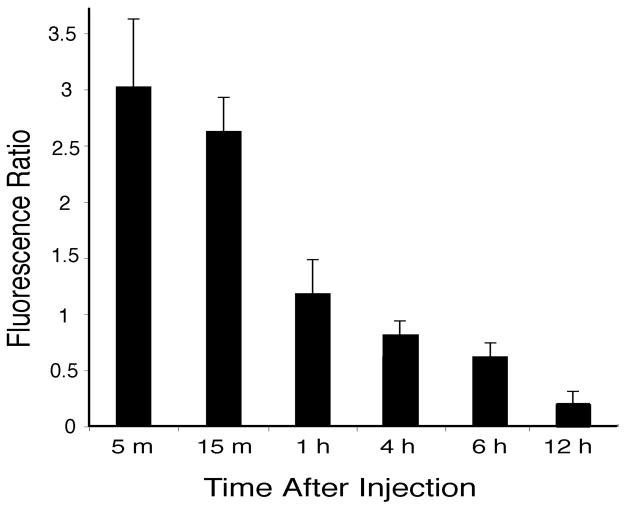
Previous work demonstrated that liposomes, containing an amino acid sequence that binds to hepatic heparan sulfate glycosaminoglycan, show effective targeting to liver hepatocytes. These liposomes were tested to determine whether they can deliver doxorubicin selectively to liver and hepatocytes in vivo. Fluid-phase liposomes contained a lipid-anchored 19-amino acid glycosaminoglycan targeting peptide. Liposomes were loaded with doxorubicin and were non-leaky in the presence of serum. After intravenous administration to mice, organs were harvested and the doxorubicin content extracted and measured by fluorescence intensity and by fluorescence microscopy. The liposomal doxorubicin was recovered almost entirely from liver, with only trace amounts detectable in heart, lung, and kidney. Fluorescence microscopy demonstrated doxorubicin preferentially in hepatocytes, also in non-parenchymal cells of the liver, but not in cells of heart, lung or kidney. The doxorubicin was localized within liver cell nuclei within 5 min after intravenous injection. These studies demonstrated that liposomal doxorubicin can be effectively delivered to hepatocytes by targeting the heparan sulfate glycosaminoglycan of liver tissue. With the composition described here, the doxorubicin was rapidly released from the liposomes without the need for an externally supplied stimulus.


Figures

Fig. 1
Fig. 1
Loading efficiency of doxorubicin into liver-targeting liposomes. Doxorubicin was added to liver-targeting liposomes at the indicated ratios and left overnight at 37°C. Free vs. encapsulated doxorubicin was determined by the G-75 Sephadex column chromatography procedure. Values are mean ± s.e.m., n=3.
Fig. 2
Fig. 2
Absence of leakage of doxorubicin from liver-targeting liposomes in the presence of 80% calf serum. Liposomes (0.5 μmol) containing 0.25 mg doxorubicin per μmol liposomal lipid were incubated with calf serum in a 2:8 ratio at 37°C for the indicated times. Afterwards, free and encapsulated doxorubicin were determined by the G-75 Sephadex column chromatography procedure. Values are mean ± s.e.m., n=3.
Fig. 3
Fig. 3
Clearance of liver-targeting liposomes from plasma. Each BALB/c mouse was injected via the tail vein with a solution containing either 400 nmol liver-targeting liposomes, or 400 nmol control liposomes in which the liver-targeting peptide was omitted from the formulation. Blood samples were collected at 10 min and 1 h, and the quantity of liposomal lipid in the plasma determined by measurement of Bodipy-FL fluorescence, as described in the Materials and Methods. Values are nmol of liposomal lipid per mL plasma. Error bars are s.e.m, n=4.
Fig. 4
Fig. 4
(A) Comparison of fluorescence emission spectrum of doxorubicin extracted from liver tissue and heart tissue from an animal treated with doxorubicin-loaded, liver-targeting liposomes. (B) Correction of the fluorescence emission scan of tissue-extracted doxorubicin for autofluorescence. In this example, the fluorescence emission scan of the chloroform extract of heart tissue not treated with doxorubicin (not shown) was subtracted from the fluorescence emission scan of heart tissue from an animal treated with liver-targeting liposomes (“uncorrected”). The corrected spectrum exhibits zero baseline at 500 and 700 nm, and a characteristic doxorubicin fluorescence emission spectrum.
Fig. 4
Fig. 4
(A) Comparison of fluorescence emission spectrum of doxorubicin extracted from liver tissue and heart tissue from an animal treated with doxorubicin-loaded, liver-targeting liposomes. (B) Correction of the fluorescence emission scan of tissue-extracted doxorubicin for autofluorescence. In this example, the fluorescence emission scan of the chloroform extract of heart tissue not treated with doxorubicin (not shown) was subtracted from the fluorescence emission scan of heart tissue from an animal treated with liver-targeting liposomes (“uncorrected”). The corrected spectrum exhibits zero baseline at 500 and 700 nm, and a characteristic doxorubicin fluorescence emission spectrum.
Fig. 5
Fig. 5
Organ biodistribution of doxorubicin in animals treated with free doxorubicin vs. animals treated with doxorubicin encapsulated into liver-targeting liposomes. Mice received a tail-vein injection of either 100 μg free doxorubicin, or 0.4 μmol liver-targeting liposomes with 100 μg encapsulated doxorubicin. Tissues were harvested after 1 h and doxorubicin extracted into organic solvent as described in Materials and Methods. Fluorescence emission spectra were measured and corrected for autofluorescence as shown in Fig. 4B. Micrograms doxorubicin were determined by comparing the fluorescence intensity at 590 nm to fluorescence intensities of known quantities of doxorubicin carried through an identical extraction procedure. (A) Biodistribution of free doxorubicin 1 h after injection. (B) Biodistribution of doxorubicin encapsulated into liver-targeting liposomes after 1 h. Values are mean ± s.e.m., n=4.
Fig. 5
Fig. 5
Organ biodistribution of doxorubicin in animals treated with free doxorubicin vs. animals treated with doxorubicin encapsulated into liver-targeting liposomes. Mice received a tail-vein injection of either 100 μg free doxorubicin, or 0.4 μmol liver-targeting liposomes with 100 μg encapsulated doxorubicin. Tissues were harvested after 1 h and doxorubicin extracted into organic solvent as described in Materials and Methods. Fluorescence emission spectra were measured and corrected for autofluorescence as shown in Fig. 4B. Micrograms doxorubicin were determined by comparing the fluorescence intensity at 590 nm to fluorescence intensities of known quantities of doxorubicin carried through an identical extraction procedure. (A) Biodistribution of free doxorubicin 1 h after injection. (B) Biodistribution of doxorubicin encapsulated into liver-targeting liposomes after 1 h. Values are mean ± s.e.m., n=4.
Fig. 6
Fig. 6
Fluorescence photomicrographs of tissue from an adult BALB/c mouse injected with doxorubicin, contained within liver-targeting liposomes, 1h prior to euthanasia. For each organ, the same tissue section is shown under rhodamine epifluorescence for doxorubicin (left column) and ultraviolet epifluorescence for DAPI nuclear labeling (right column). (A and B) Liver. (C and D) Heart. (E and F) Kidney. (G and H) Spleen. Note distinct red fluorescent doxorubicin labeling of cell nuclei in liver, but not heart or kidney. Doxorubicin labeling of cells in the marginal zone of spleen also is detected. cv: central vein; mz: marginal zone; wp: white pulp. Calibration bar in H = 100 μm and is the same for all photomicrographs.
Fig. 7
Fig. 7
Fluorescence photomicrographs of tissue from an adult BALB/c mouse injected with free doxorubicin 1h prior to euthanasia. For each organ, the same tissue section is shown under rhodamine epifluorescence for doxorubicin (left column) and ultraviolet epifluorescence for DAPI nuclear labeling (right column). (A and B) Liver. (C and D) Heart. (E and F) Kidney. (G and H) Spleen. Note distinct red fluorescent doxorubicin labeling of cell nuclei in all tissues. cv: central vein; gl: glomerulus; mz: marginal zone; rp: red pulp; wp: white pulp. Calibration bar in H = 100 μm and is the same for all photomicrographs.
Fig. 8
Fig. 8
Fluorescence photomicrographs showing relationships of doxorubicin labeling and other cell labeling techniques in liver sections. (A) Rhodamine optics reveal doxorubicin labeled nuclei. Note varied shapes of labeled nuclei. (B) UV fluorescence optics reveal DAPI labeled cell nuclei in same section as shown in ‘A’. Note virtually all nuclei are labeled both by doxorubicin and by DAPI. (C) Merged images A and B; double labeled cell nuclei appear as purple. (D) Merged image showing doxorubicin labeled cell nuclei (orange) and F4-80 immunocytochemically labeled Kupffer cells in green (arrows). (E) Merged image showing doxorubicin labeled cell nuclei (orange) and hepatocytes immunocytochemically labeled for albumin (green). (F) Merged image showing doxorubicin labeled nuclei (orange) and GFAP labeled Ito stellate cells (arrows) in green. (G) Pseudocolored image from deconvolution software showing a doxorubicin labeled red nucleus within a F4-80 green labeled cell. cv: central vein; hn: hepatocyte nucleus. Calibration bar in F = 50 μm and is the same for panels A through F. Calibration bar in G = 4μm.
Fig. 9
Fig. 9
Fluorescence photomicrographs of doxorubicin labeling of liver cell nuclei at varied times after intravenous injections of liver-targeting liposomes. (A) 5 min. (B) 1 h. (C) 4 h. (D) 6 h. (E) 12 h. (F) Double labeled tissue after 22 h, showing an example of a red doxorubicin labeled nucleus within a green F4-80 labeled Kupffer cell.
Fig. 10
Fig. 10
Histogram showing the ratio of intensity of doxorubicin labeled round nuclei (of presumed hepatocytes) relative to the intensity of doxorubicin labeled oval nuclei (of non-parenchymal cells), from animals euthanized at varied times after intravenous injections of doxorubicin containing within liver-targeting liposomes. Bars show mean ratios, with standard deviations.

References

    1. Abraham SA, Waterhouse DN, Mayer LD, Cullis PR, Madden TD, Bally MD. The liposomal formulation of doxorubicin. Methods Enzymol. 2005;391:71–97. - PubMed
    1. Austyn JM, Gordon S. F4/80, a monoclonal antibody directed specifically against the mouse macrophage. Eur J Immunol. 1981;11:805–815. - PubMed
    1. Baratta JL, Ngo A, Lopez B, Longmuir KJ, Robertson RT. Cellular organization of normal mouse liver: a histological, quantitative immunocytochemical, and fine structural analysis. Histochem Cell Biol. 2009;131:713–726. - PMC - PubMed
    1. Byrne JD, Betancourt T, Brannon-Peppas L. Active targeting schemes for nanoparticle systems in cancer therapeutics. Adv Drug Deliv Rev. 2008;60:1615–1626. - PubMed
    1. Daemen T, Velinova M, Regts J, de Jager M, Kalicharan R, Donga J, van der Want JJ, Scherphof GL. Different intrahepatic distribution of phosophatidylglycerol and phosphatidylserine liposomes in the rat. Hepatology. 1997;26:416–423. - PubMed

Publication types

MeSH terms