

Review
doi: 10.1016/j.bbapap.2009.07.021.
Epub 2009 Aug 7.
Techniques used to study the DNA polymerase reaction pathway
Affiliations
- PMID: 19665596
- PMCID: PMC2846202
- DOI: 10.1016/j.bbapap.2009.07.021
Item in Clipboard
Review
Techniques used to study the DNA polymerase reaction pathway
Biochim Biophys Acta.
2010 May.
Abstract
A minimal reaction pathway for DNA polymerases was established over 20years ago using chemical-quench methods. Since that time there has been considerable interest in noncovalent steps in the reaction pathway, conformational changes involving the polymerase or its DNA substrate that may play a role in substrate specificity. Fluorescence-based assays have been devised in order to study these conformational transitions and the results obtained have added new detail to the reaction pathway.
Copyright (c) 2010 Elsevier B.V. All rights reserved.
Figures
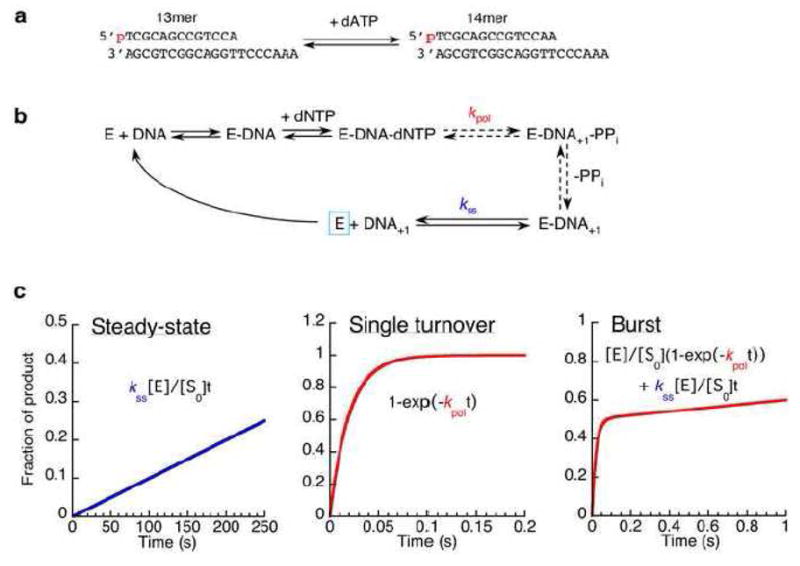
a. The 13/20mer template-primer used in many of the early DNA polymerase studies [34]. The primer strand is 5′ labeled with 32P. b. Simplified pathway for the DNA polymerase reaction. Dashed arrows indicate processes comprising several steps. The single-turnover rate, kpol, corresponds to the slowest step up to and including chemistry. The steady-state rate, kss, is the dissociation of the product DNA, required in order for the polymerase (E, outlined in blue) to carry out multiple turnovers. c. The time course of product formation expected for three different experimental setups, calculated with kpol set at 50 s−1 and kss at 0.2 s−1. In each case, the vertical axis indicates the fraction of the DNA primer strand that has been converted to product by the polymerase, based on the equations shown. The important difference between the three experiments is the ratio of polymerase (E) to DNA (S0). [E]:[S0] is 1:200 in the steady-state experiment, and 1:2 in the burst experiment. In the single-turnover experiment, the precise ratio is unimportant provided that the polymerase is in excess over the DNA and all the DNA is enzyme-bound.
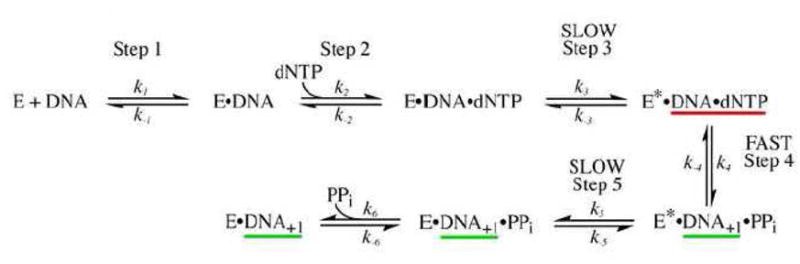
The minimal reaction pathway for Pol I(KF) based on chemical-quench experiments [16, 34]. When the reaction is quenched with acid, the species underlined in green are detected as product. When the reaction is chased, the yield of product is higher because the intermediate underlined in red is also converted to product.
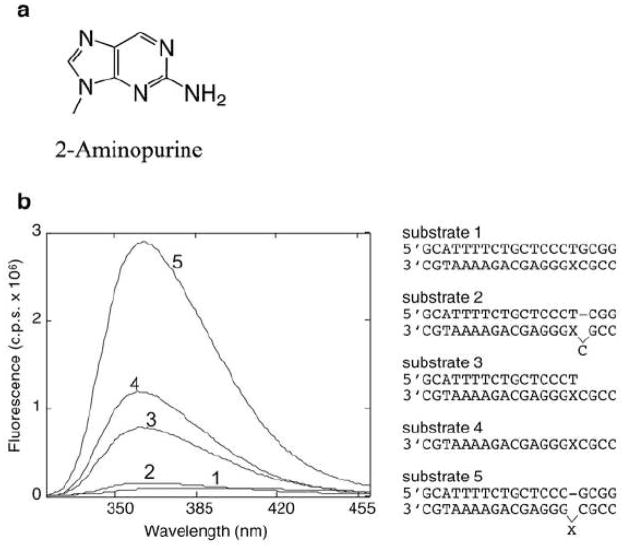
2-aminopurine (2-AP, structure shown in a) as a fluorescence probe in DNA. b. Fluorescence emission spectra of model 2-AP substrates, using an excitation wavelength of 310 nm.. The model DNA substrates, where X indicates 2-AP on the listed sequences, were as follows. 1, 2-AP in fully duplex DNA; 2, 2-AP whose 5′ neighbor lacks a base-pairing partner; 3, a template-primer duplex with 2-AP opposite the primer terminus; 4, 2-AP in single-stranded DNA; 5, 2-AP that lacks a base-pairing partner. The largest fluorescence signal was obtained from 2-AP lacking a base-pairing partner, illustrating the role of base-stacking in quenching 2-AP fluorescence. Adapted from ref. [27].
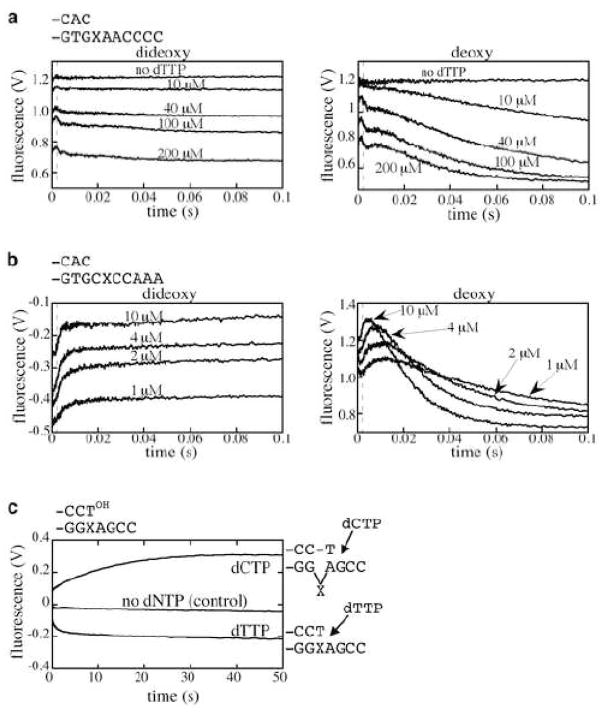
a. Addition of dTTP opposite 2-AP at the templating position, catalyzed by Pol I(KF), from ref. [26]. With both the nonextendable (dideoxy-terminated) and the extendable (deoxy-terminated) primer, a rapid fluorescence decrease occurs within the dead-time of the stopped-flow instrument (≥ 1000 s−1). With the extendable primer, there is a further fluorescence decrease whose rate is similar to that observed in chemical quench experiments, implying that the fluorescence and chemical quench assays are both rate-limited by the same slow prechemistry step. b. An experiment similar to that in a, except that the 2-AP probe is in the position 5′ to the templating base, from ref. [26]. The initial rapid fluorescence increase (200 to 500 s−1) is followed, when the primer is extendable, by a fluorescence decrease at a rate similar to the chemical quench rate. c. 2-AP fluorescence as a reporter of the base-skipping reaction catalyzed by the Y-family DNA polymerase, Dbh from S. acidocaldarius [27]. Fluorescence changes were observed by stopped-flow when dCTP (base-skipping) or dTTP (correct insertion) was added (final concentration 2 mM) to a binary complex of Dbh with DNA having 2-AP at the T(-1) position. The control trace corresponds to the addition of reaction buffer without nucleotide. The fluorescence increase on addition of dCTP, attributed to the intermediate shown to the right of the trace, required the complementary G at the T(+1) position and was not seen with a control DNA template lacking this G (data not shown).
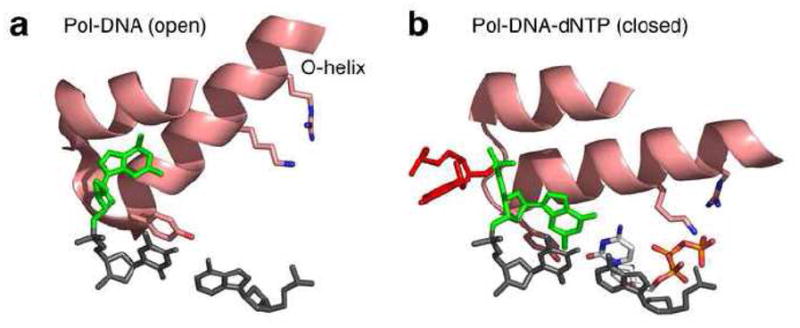
The positions of the T(0) and T(+1) bases in binary (a, PDB file 1L3U) and ternary (b, PDB file 1LV5) complexes of the Pol I(KF) homologue from B. stearothermophilus [30]. In both panels, the protein is represented by the O and O1 helices, and the highly conserved Tyr, Lys and Arg side chains on the O helix are shown. The primer terminal base pair is colored dark grey and the incoming dNTP in panel b is shown in CPK colors. The templating base, T(0), is colored green and its 5′ neighbor, T(+1), is red. The T(+1) base is not present in the 1L3U data file, presumably because it was disordered in the crystals. This illustration was made using PyMOL (DeLano Scientific).
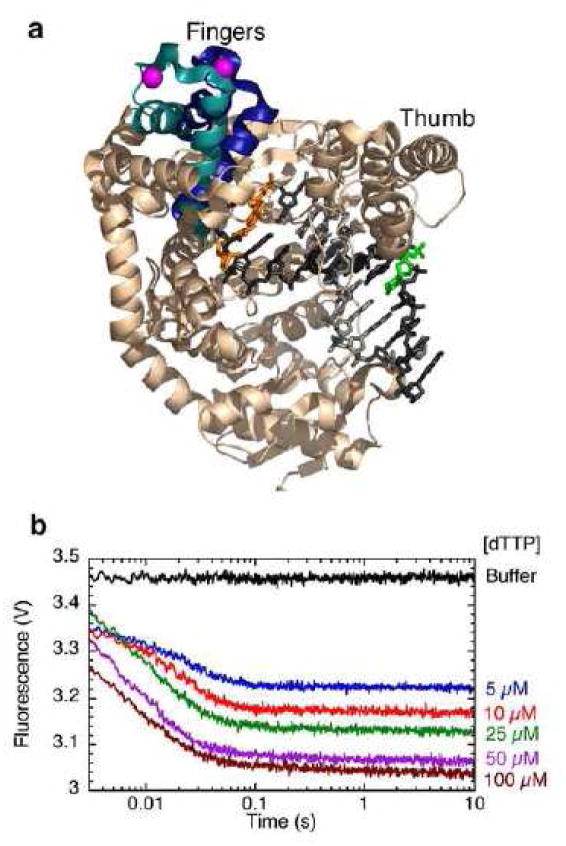
a. The fingers-closing transition is illustrated using structural data from the Pol I(KF) homologue from B. stearothermophilus [30]. The backbone structure of the binary complex (PDB file 1L3U) is shown predominantly in beige. The chain trace of the ternary complex (PDB file 1LV5) is essentially identical to the binary complex except for the mobile portion of the fingers subdomain, shown in teal in the binary complex and dark blue in the ternary complex. The magenta sphere marks the beta carbon of the side chain (744 in Pol I(KF)) used for attachment of the FRET donor (IAEDANS). The DNA primer-template is shown predominantly in grey, with the template strand in a darker shade. The primer-terminal base pair is colored orange, and the green base at the T(−8) position marks the position of a dabcyl-dT quencher, serving as the FRET acceptor. The distance between donor and acceptor attachment points is 50.4 Å in the open conformation and 43.8 Å in the closed conformation (Förster distance ≈ 40 Å for IAEDANS-dabcyl). This illustration was made using PyMOL (DeLano Scientific). b. Stopped-flow fluorescence study of the fingers-closing conformational change using the labeling scheme described in a. A binary complex of 744-AEDANS Pol I(KF) with a non-extendable dabcyl DNA was mixed in the stopped-flow instrument with the complementary nucleotide, dTTP, to give the final concentrations indicated. The rate of the fluorescence decrease gave a fingers-closing rate of 140 s−1. To improve the detection of rapid processes the data were collected and plotted using a logarithmic timescale.
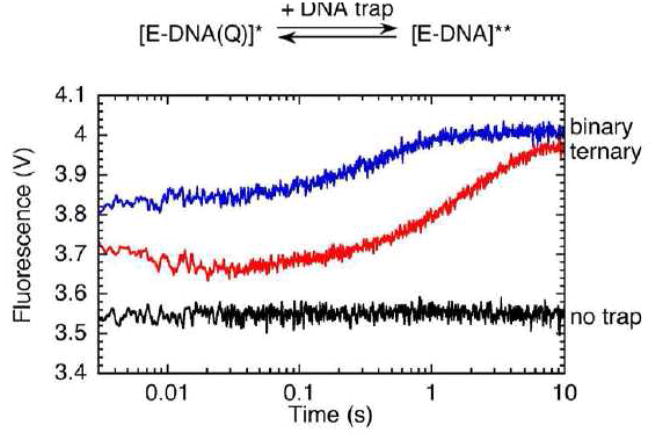
Measurement of DNA dissociation using the FRET system described in Fig. 6. A binary complex of the fluorescent Pol I(KF) with the quencher-labeled (Q) DNA was mixed in the stopped-flow instrument with a large excess of unlabeled DNA. Dissociation of the quencher-DNA and its replacement with unlabeled DNA caused the fluorescence of the complex to increase (designated as * to **). The fluorescence traces gave a DNA dissociation rate of 2.4 s−1 from the binary complex and 0.5 s−1 from the ternary complex, formed by adding the complementary nucleotide, dTTP (to 50 μM). As in Fig. 6, a logarithmic timescale was used.
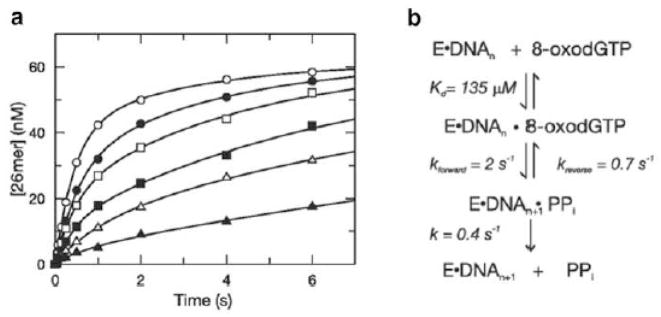
a. Chemical-quench data for the addition of 8-oxo-dGTP opposite a template C by the human mitochondrial DNA polymerase. Product formation was measured as a function of time at a series of nucleotide concentrations. Contrary to expectations, the reactions were extremely biphasic and the amplitude of the fast phase was dependent on nucleotide concentration. b. Reaction mechanism that explains the rate data shown in a. The slow step after product formation causes the chemical step to come to equilibrium. Adapted from ref. [40].
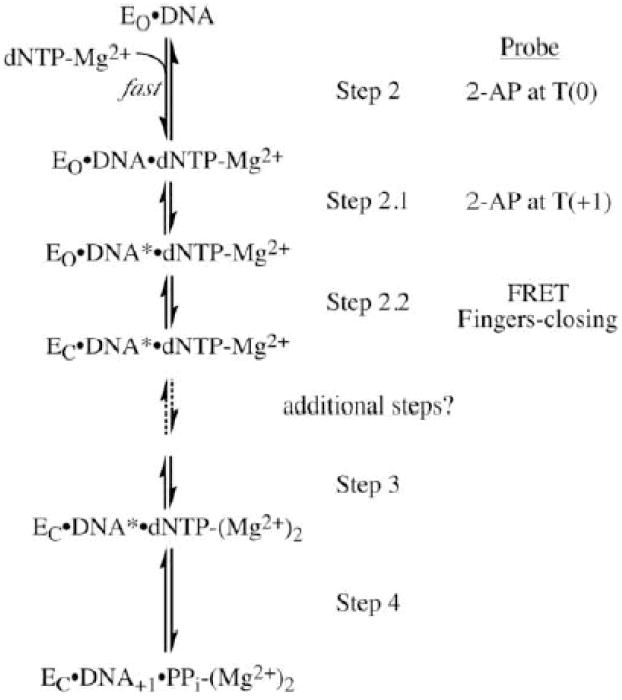
A revised polymerase reaction pathway for Pol I(KF) from DNA binding up to the phosphoryl transfer step. The minimal pathway based on chemical-quench experiments [16, 34] has been updated to reflect information derived from fluorescence studies. The numbering used by Dahlberg and Benkovic [16] has been retained and the new steps are designated 2.1 and 2.2. EO and EC represent the open and closed conformations of the polymerase. Formation of DNA* in step 2.1 represents the DNA rearrangement that is detected with the T(+1)2-AP probe. The order of steps 2.1 and 2.2 is based on experiments using ribonucleotides as substrate analogues [29]. Reprinted with permission from ref. [29]. Copyright 2008 American Chemical Society.
References
-
- Johnson KA. Transient-state kinetic analysis of enzyme reaction pathways. In: Boyer PD, editor. The Enzymes. Academic Press; New York: 1992. pp. 1–61.
-
- Fersht A. Enzyme structure and mechanism. 2. W. H. Freeman; New York: 1985.
Publication types
MeSH terms
Substances
Grants and funding
LinkOut - more resources
Full Text Sources
Other Literature Sources
