

Gene expression changes in the nucleus accumbens of alcohol-preferring rats following chronic ethanol consumption
- PMID: 19666046
- PMCID: PMC2771758
- DOI: 10.1016/j.pbb.2009.07.019
Gene expression changes in the nucleus accumbens of alcohol-preferring rats following chronic ethanol consumption
Abstract
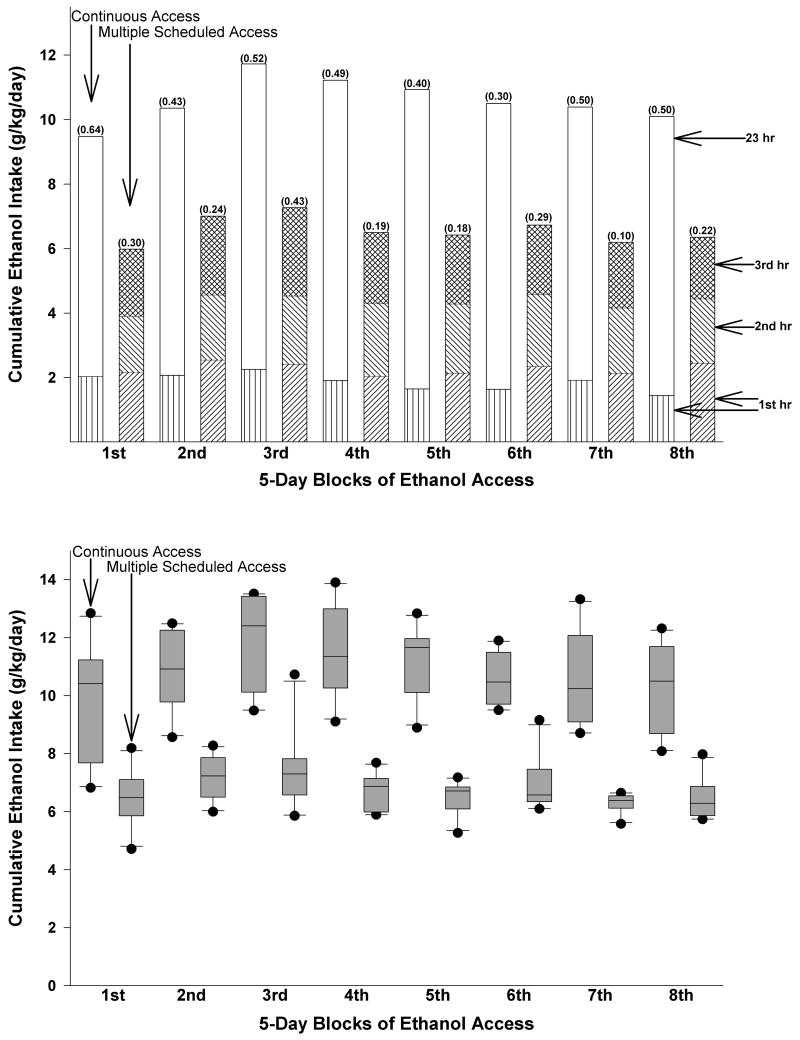
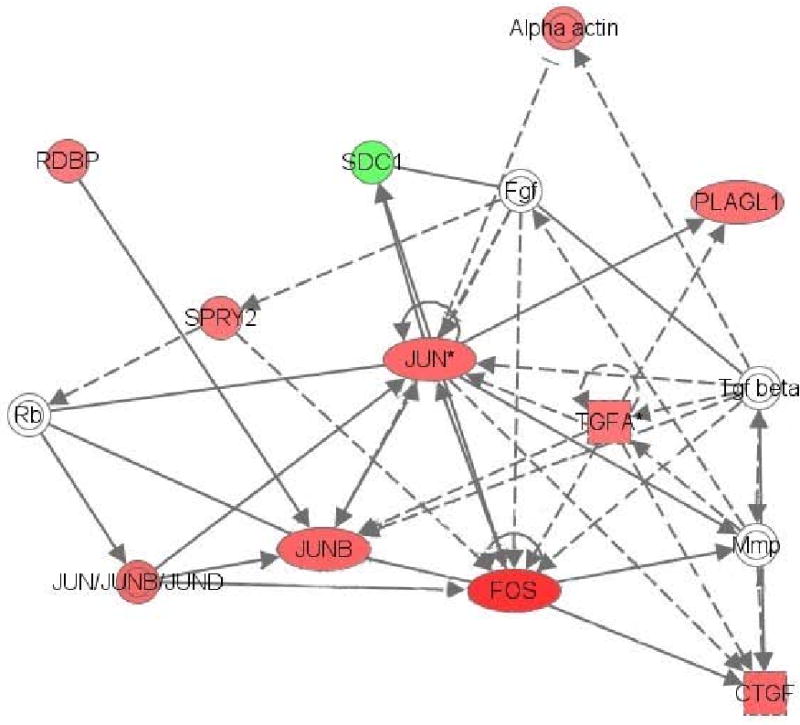
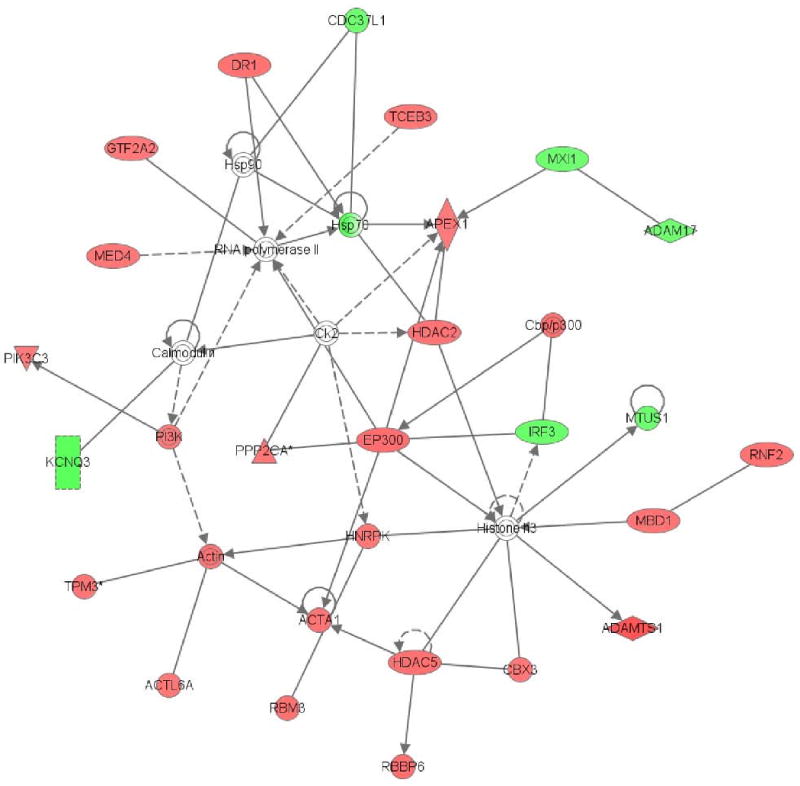
The objective of this study was to determine the effects of binge-like alcohol drinking on gene expression changes in the nucleus accumbens (ACB) of alcohol-preferring (P) rats. Adult male P rats were given ethanol under multiple scheduled access (MSA; three 1-h dark cycle sessions/day) conditions for 8 weeks. For comparison purposes, a second ethanol drinking group was given continuous/daily alcohol access (CA; 24h/day). A third group was ethanol-naïve (W group). Average ethanol intakes for the CA and MSA groups were approximately 9.5 and 6.5 g/kg/day, respectively. Fifteen hours after the last drinking episode, rats were euthanized, the brains extracted, and the ACB dissected. RNA was extracted and purified for microarray analysis. The only significant differences were between the CA and W groups (p<0.01; Storey false discovery rate=0.15); there were 374 differences in named genes between these 2 groups. There were 20 significant Gene Ontology (GO) categories, which included negative regulation of protein kinase activity, anti-apoptosis, and regulation of G-protein coupled receptor signaling. Ingenuity analysis indicated a network of transcription factors, involving oncogenes (Fos, Jun, Junb had higher expression in the ACB of the CA group), suggesting increased neuronal activity. There were 43 genes located within rat QTLs for alcohol consumption and preference; 4 of these genes (Tgfa, Hspa5, Mtus1 and Creb3l2) are involved in anti-apoptosis and increased transcription, suggesting that they may be contributing to cellular protection and maintaining high alcohol intakes. Overall, these findings suggest that chronic CA drinking results in genomic changes that can be observed during the early acute phase of ethanol withdrawal. Conversely, chronic MSA drinking, with its associated protracted withdrawal periods, results in genomic changes that may be masked by tight regulation of these genes following repeated experiences of ethanol withdrawal.
Figures
References
-
- Ammon S, Mayer P, Riechert U, Tischmeyer H, Hollt V. Microarray analysis of genes expressed in the frontal cortex of rats chronically treated with morphine and after naloxone precipitated withdrawal. Brain Res Mol Brain Res. 2003;112:113–125. - PubMed
-
- Babu PP, Kumari LR, Vemuri MC. Differential changes in cell morphology, macromolecular composition and membrane protein profiles of neurons and astrocytes in chronic ethanol treated rats. Mol Cell Biochem. 1994;130:29–40. - PubMed
-
- Bell RL, Hauser SR, Smith RJ, McConnell KK, Rodd ZA, McBride WJ. Evaluating withdrawal-like behavior 8 to 15 hours after cessation of chronic 24-hr free-choice ethanol drinking in alcohol-preferring (P) rats. Alcohol Clin Exp Res. 2009;33(S1):139A. - PubMed
Publication types
MeSH terms
Substances
Grants and funding
- U01 AA013521/AA/NIAAA NIH HHS/United States
- R24 AA015512/AA/NIAAA NIH HHS/United States
- U01 AA016660/AA/NIAAA NIH HHS/United States
- AA13521/AA/NIAAA NIH HHS/United States
- U01 AA016652/AA/NIAAA NIH HHS/United States
- P60 AA007611/AA/NIAAA NIH HHS/United States
- P50 AA007611/AA/NIAAA NIH HHS/United States
- AA13522/AA/NIAAA NIH HHS/United States
- AA016652/AA/NIAAA NIH HHS/United States
- AA07611/AA/NIAAA NIH HHS/United States
- U01 AA013522/AA/NIAAA NIH HHS/United States
- U24 AA013522/AA/NIAAA NIH HHS/United States
- AA16660/AA/NIAAA NIH HHS/United States
LinkOut - more resources
Full Text Sources
Medical
Molecular Biology Databases
Miscellaneous
