. 2009 Oct 2;284(40):27077-89.
doi: 10.1074/jbc.M109.031336. Epub 2009 Aug 7.

Elimination of the CDP-ethanolamine pathway disrupts hepatic lipid homeostasis

Affiliations

Elimination of the CDP-ethanolamine pathway disrupts hepatic lipid homeostasis

Roberta Leonardi et al. J Biol Chem. .

Abstract

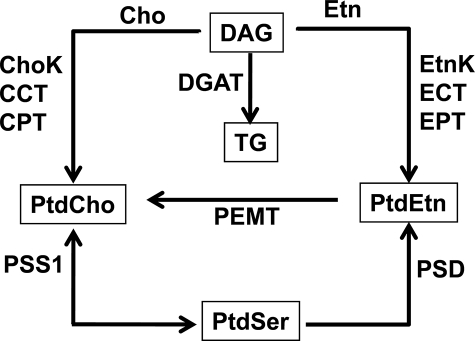
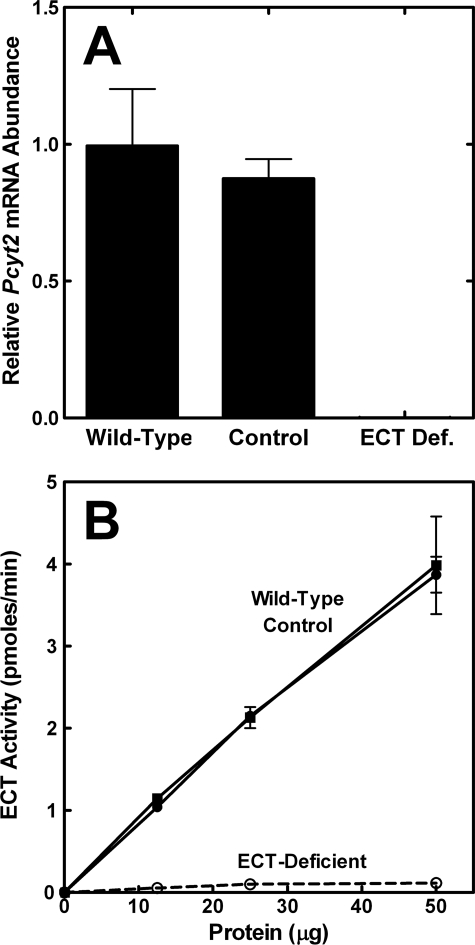
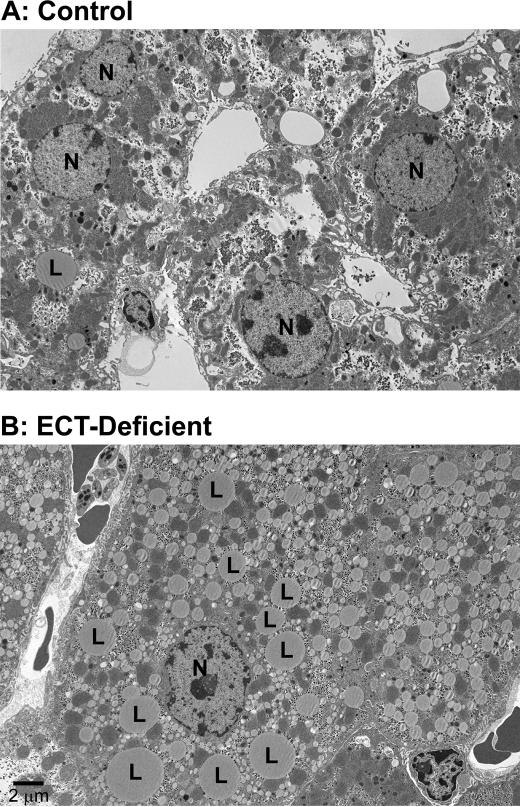
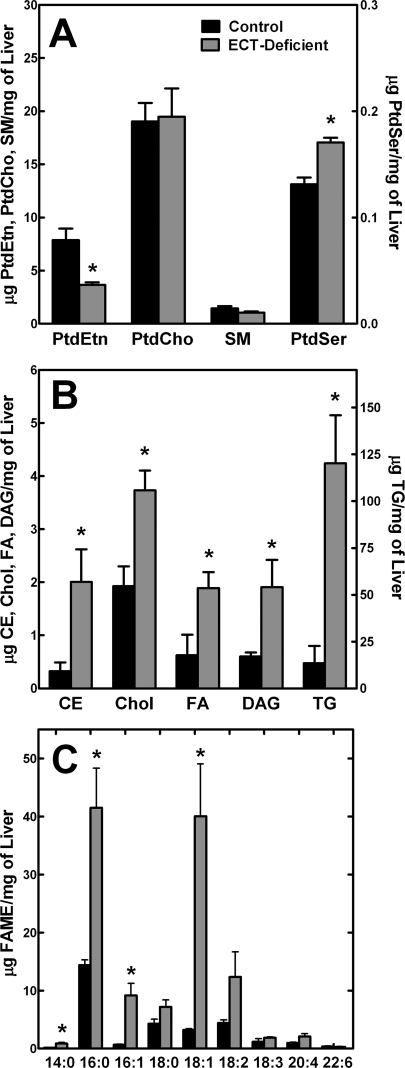
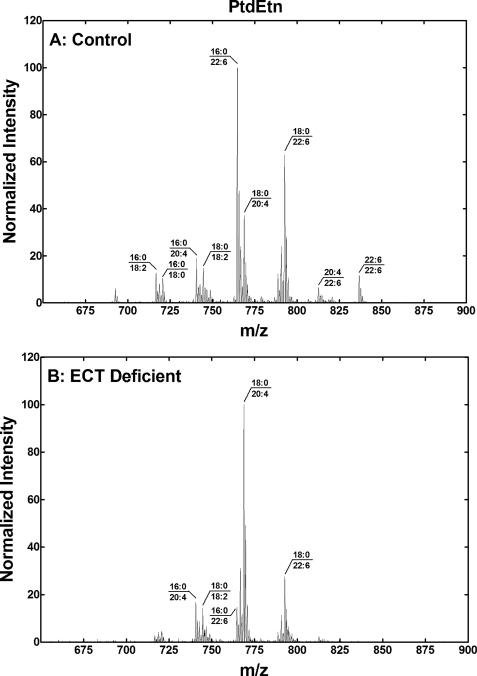
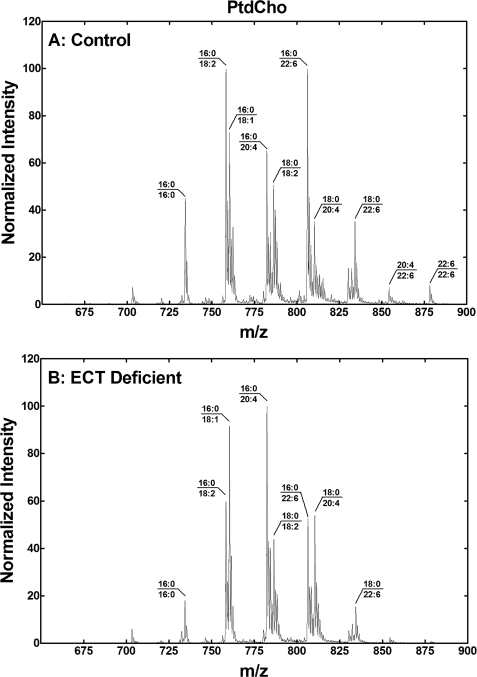
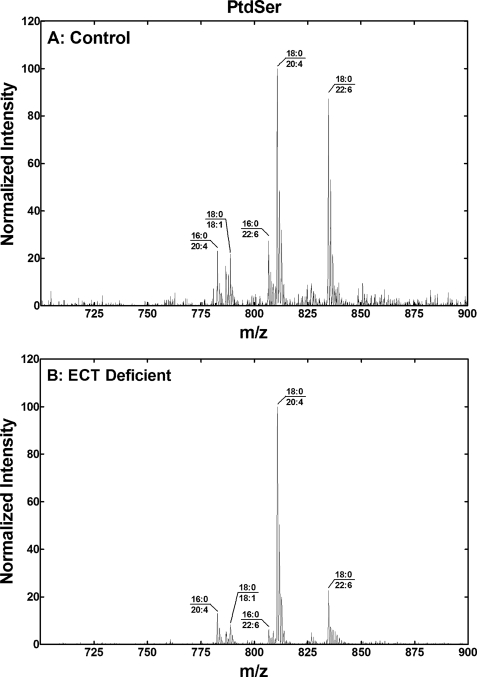
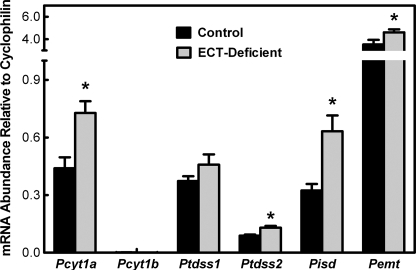
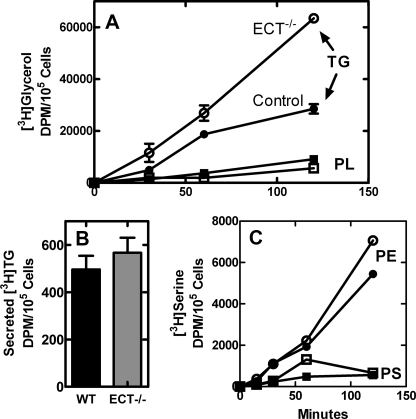
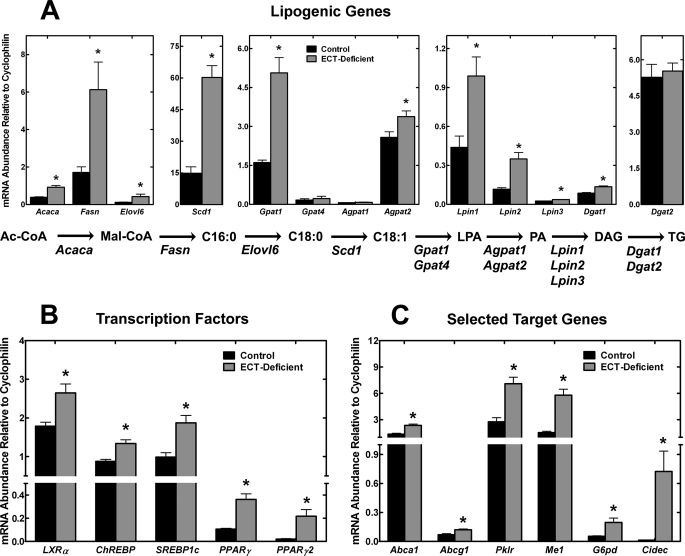
Phosphoethanolamine cytidylyltransferase (ECT) catalyzes the rate-controlling step in a major pathway for the synthesis of phosphatidylethanolamine (PtdEtn). Hepatocyte-specific deletion of the ECT gene in mice resulted in normal appearing animals without overt signs of liver injury or inflammation. The molecular species of PtdEtn in the ECT-deficient livers were significantly altered compared with controls and matched the composition of the phosphatidylserine (PtdSer) pool, illustrating the complete reliance on the PtdSer decarboxylase pathway for PtdEtn synthesis. PtdSer structure was controlled by the substrate specificity of PtdSer synthase that selectively converted phosphatidylcholine molecular species containing stearate paired with a polyunsaturated fatty acid to PtdSer. There was no evidence for fatty acid remodeling of PtdEtn. The elimination of diacylglycerol utilization by the CDP-ethanolamine pathway led to a 10-fold increase in triacylglycerols in the ECT-deficient hepatocytes that became engorged with lipid droplets. Triacylglycerol accumulation was associated with a significant elevation in the expression of the transcription factors and target genes that drive de novo lipogenesis. The absence of the ECT pathway for diacylglycerol utilization at the endoplasmic reticulum triggers increased fatty acid synthesis to support the formation of triacylglycerols leading to liver steatosis.


Figures

FIGURE 1.
FIGURE 1.
Schematic overview of hepatic lipid biosynthetic pathways. There are multiple inter-related pathways for the formation of the major liver phospholipids. The diet is a principal source for Cho and Etn, as well as the fatty acids that are assembled into DAG. Fatty acids may also be derived from de novo fatty acid biosynthesis or transported to the liver from adipose tissue. The major route to PtdCho is the CDP-Cho pathway: Cho kinase (ChoK), CCT, and Cho phosphotransferase (CPT). A major route to PtdEtn is the CDP-Etn pathway: Etn kinase (EtnK), ECT, and Etn phosphotransferase (EPT). Also, PtdCho is converted to PtdEtn by base-exchange with serine to form PtdSer, followed by its conversion to PtdEtn by decarboxylation (PSD) or potentially by another base-exchange enzyme (PSS2) that exchanges Etn for serine. PtdCho is produced from PtdEtn through sequential methylation by PEMT. TG is formed by DAG acyltransferases (DGAT) from the DAG that is not devoted to the synthesis of phospholipids.
FIGURE 2.
FIGURE 2.
Creation of the hepatocyte-specific Pcyt2 (ECT) gene deletion. A, diagram (not to scale) shows the targeting plasmid at the top, highlighting the genomic insertion cassette that confers cellular resistance to neomycin (NeoTK). Line 2 shows the structure of the wild-type allele that was replaced by recombination with the insertion cassette. Line 3 shows the gene structure after recombination in embryonic stem cells. Line 4 shows the floxed (fl) allele that resulted from a cross between mice carrying the insertion cassette and transgenic mice expressing the FLP recombinase. FLP mediated excision of the NeoTK selection cassette left only short DNA sequences within the two introns encoding two LoxP sites (▶) and a residual Frt site (◁). These were called floxed mice and served as the wild-type littermate controls. Line 5 shows the ECT allele that was deleted in the livers of progeny arising from a cross between floxed mice and mice that expressed the Alb-Cre transgene. The deleted ECT allele lacked exon 2 and retained a single 34-bp LoxP site in the intron between exons 1 and 3. F1 is the forward PCR primer, and R1 and R2 are the two reverse PCR primers used for genotyping. B, DNA was extracted from mouse tails and liver samples from either nonfloxed wild-type (WT) mice, control floxed (Flox/Flox) mice lacking the transgene (Pcyt2fl/fl/Alb-Cre0/0), heterozygous floxed (WT/Flox) mice, or knock-out (KO) mice expressing the Cre recombinase in liver (Pcyt2fl/fl/Alb-Cre+/0). Tail samples are as follows: lane 1, wild-type mouse (Pcyt2+/+); lane 2, heterozygous mouse (Pcyt+/fl); and lane 3, floxed mouse (Pcyt2fl/fl). Liver samples are as follows: lane 4, a control liver (Pcyt2fl/fl/Alb-Cre0/0) with the 406-bp floxed band; and lane 5, an ECT-deficient liver (Pcyt2fl/fl/Alb-Cre+/0) with the 207-bp ECT knock-out band. Lane 6, hepatocytes (H) isolated from an ECT-deficient liver. C, DNA was extracted from the brain (lanes 1–6), kidney (lanes 7–12), and liver (lanes 13–18) of three control female mice (Flox/Flox, lanes 1–3, 7–9, and 13–15) or three knock-out female mice (KO, lanes 4–6, 10–12, and 16–18). Multiplex PCR was performed using primers F1 plus R1 + R2 to genotype liver, kidney, brain and hepatocyte samples.
FIGURE 3.
FIGURE 3.
ECT mRNA and enzyme activity in ECT-deficient liver. A, ECT mRNA levels in livers from Pcyt2fl/fl/Alb-Cre0/0 (control), wild-type, and Pcyt2fl/fl/Alb-Cre+/0 tail genotypes were quantified by real time PCR (qRT-PCR). The qRT-PCR assay was designed to detect Pcyt2 transcripts containing exon 2, and the knock-out liver samples had <1:5,000 of control transcripts. Data are the average values from two males plus two females of each genotype, performed in triplicate. B, ECT enzymatic activity was measured as a function of protein concentration in liver cytosols prepared from wild-type (■), control (floxed) (●), and ECT-deficient mice (○). The data are the average ± S.D. of duplicate determinations from four mice (two males and two females) of each genotype.
FIGURE 4.
FIGURE 4.
Transmission electron microscopy of ECT-deficient liver. A, control liver morphology. B, ECT-deficient liver with hepatocytes engorged with lipid droplets. L, lipid droplet; N, cell nucleus. Both livers were from female mice.
FIGURE 5.
FIGURE 5.
Lipid composition of the ECT-deficient liver. A, amounts of the major phospholipid classes in control and ECT-deficient livers. SM, sphingomyelin. B, neutral lipid classes in control and ECT-deficient livers. Liver lipids were extracted, separated, and quantified as described under “Experimental Procedures.” Note the difference in scale for the TG dataset. The data are the average ± S.D. of triplicate determinations from 6 to 7 males for each genotype. CE, cholesterol ester; Chol, cholesterol; FA, fatty acid. C, total fatty acid composition of control and ECT-deficient livers. Hepatic lipids were extracted, converted to the respective fatty acid methyl esters (FAME), and analyzed by gas chromatography. The data are the average of three males per genotype ± S.D. Solid bars represent control (floxed) livers, and the gray bars represent ECT-deficient livers. *, p < 0.05.
FIGURE 6.
FIGURE 6.
PtdEtn, molecular species in the ECT-deficient liver. A, PtdEtn molecular species fingerprint of a typical control mouse liver. B, PtdEtn molecular species analysis of a typical ECT-deficient liver. The data are representative of duplicate analyses on three different male mice of each genotype. The identification of the primary phospholipid molecular species in each of the major peaks was based on the fatty acid composition, and the preponderance of saturated fatty acids in the 1-position and unsaturated fatty acids in the 2-position of hepatic phospholipids.
FIGURE 7.
FIGURE 7.
PtdCho molecular species in the ECT-deficient liver. A, molecular species fingerprint of PtdCho from a typical control liver. B, PtdCho molecular species fingerprint from a typical ECT-deficient liver. Data are representative of duplicate analyses on three different male mice of each genotype. The identification of the primary phospholipid molecular species in each of the major peaks was based on the fatty acid composition and the preponderance of saturated fatty acids in the 1-position and unsaturated fatty acids in the 2-position of hepatic phospholipids.
FIGURE 8.
FIGURE 8.
PtdSer molecular species in the ECT-deficient liver. A, molecular species fingerprint of PtdSer from a typical control liver. B, PtdSer molecular species fingerprint of PtdSer from a typical ECT-deficient liver. Data are representative of duplicate analyses on three different male mice of each genotype. The identification of the primary phospholipid molecular species in each of the major peaks was based on the fatty acid composition and the preponderance of saturated fatty acids in the 1-position and unsaturated fatty acids in the 2-position of hepatic phospholipids.
FIGURE 9.
FIGURE 9.
Expression of phospholipid biosynthetic genes in the ECT-deficient liver. The mRNA abundance for each indicated phospholipid biosynthetic gene was determined by qRT-PCR as described under “Experimental Procedures.” Solid bars represent control (floxed) livers, and the gray bars represent ECT-deficient livers. The data are the average ± S.D. of triplicate determinations from four mice (two males and two females) of each genotype. *, p < 0.05.
FIGURE 10.
FIGURE 10.
Rates of lipid synthesis in control and ECT-deficient hepatocytes. A, metabolic labeling of ECT-deficient and control hepatocytes with [3H]glycerol. The amounts of glycerol incorporated into the TG and phospholipid (PL) fractions were determined following extraction and thin layer chromatography as described under “Experimental Procedures.” ●, control TG; ○, ECT-deficient TG; ■, control phospholipid (PL); □, ECT-deficient phospholipid. The data are representative of two independent experiments. B, [3H]TG secretion. The amount of [3H]glycerol-labeled TG recovered in the medium from control and ECT-deficient hepatocytes after 2 h. WT, wild type. C, metabolic labeling of control and ECT-deficient hepatocytes with [3H]serine. ●, control PtdEtn; ○, ECT-deficient PtdEtn; ■, control PtdSer; □, ECT-deficient PtdSer.
FIGURE 11.
FIGURE 11.
Increased transcription of lipogenic genes in ECT-deficient livers. A, transcription of genes involved in the conversion of acetyl-CoA to triglycerides was significantly increased in the ECT-deficient livers. B, increase in lipogenic gene transcription correlated with a significant increase in the mRNA levels of all major transcription factors known to regulate lipogenesis, LXRα, ChREBP, SREBP1c, and PPARγ. C, additional target genes of the transcription factors shown in B were also significantly up-regulated in the ECT-deficient livers. The data are the average ± S.D. of triplicate determinations from 4 to 7 mice (males and females) of each genotype. *, p < 0.05. Acaca, acetyl-CoA carboxylase α; Fasn, fatty-acid synthase; Elovl6, long chain fatty-acid elongase 6; Scd1, stearoyl-CoA desaturase 1; Gpat1 and 4, glycerol-3-phosphate acyltransferase 1 and 4; Agpat1 and -2, 1-acylglycerol-3-phosphate O-acyltransferase 1 and 2; Lpin1, -2, and -3, Lipin 1, 2, and 3; Dgat1 and -2, diacylglycerol O-acyltransferase 1 and 2; Abca1, ATP-binding cassette transporter A1; Abcg1, ATP-binding cassette transporter G1; Pklr, pyruvate kinase liver and red blood cells; Me1, malic enzyme 1; G6pd, glucose-6-phosphate dehydrogenase; Cidec, fat-specific protein 27.

Similar articles

Cited by

References

    1. Bakovic M., Fullerton M. D., Michel V. (2007) Biochem. Cell Biol. 85, 283–300 - PubMed
    1. Vance J. E. (2008) J. Lipid Res. 49, 1377–1387 - PubMed
    1. Nagan N., Zoeller R. A. (2001) Prog. Lipid Res. 40, 199–229 - PubMed
    1. Gorgas K., Teigler A., Komljenovic D., Just W. W. (2006) Biochim. Biophys. Acta 1763, 1511–1526 - PubMed
    1. Jackowski S., Rehg J. E., Zhang Y. M., Wang J., Miller K., Jackson P., Karim M. A. (2004) Mol. Cell. Biol. 24, 4720–4733 - PMC - PubMed

Publication types

MeSH terms

LinkOut - more resources