. 2009 Oct 23;284(43):29692-703.
doi: 10.1074/jbc.M109.027144. Epub 2009 Aug 7.

HIV-1 Gag processing intermediates trans-dominantly interfere with HIV-1 infectivity

Affiliations

HIV-1 Gag processing intermediates trans-dominantly interfere with HIV-1 infectivity

Barbara Müller et al. J Biol Chem. .

Abstract

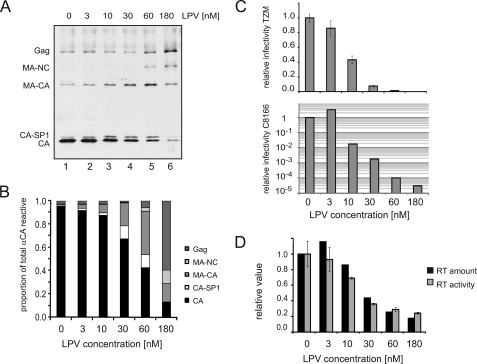
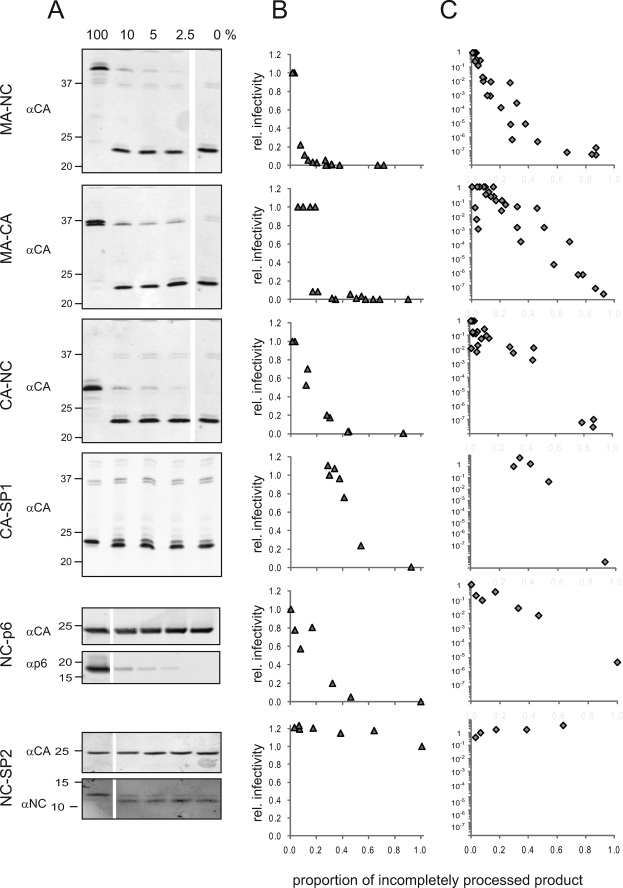
Protease inhibitors (PI) act by blocking human immunodeficiency virus (HIV) polyprotein processing, but there is no direct quantitative correlation between the degree of impairment of Gag processing and virion infectivity at low PI concentrations. To analyze the consequences of partial processing, virus particles were produced in the presence of limiting PI concentrations or by co-transfection of wild-type proviral plasmids with constructs carrying mutations in one or more cleavage sites. Low PI concentrations caused subtle changes in polyprotein processing associated with a pronounced reduction of particle infectivity. Dissection of individual stages of viral entry indicated a block in accumulation of reverse transcriptase products, whereas virus entry, enzymatic reverse transcriptase activity, and replication steps following reverse transcription were not affected. Co-expression of low amounts of partially processed forms of Gag together with wild-type HIV generally exerted a trans-dominant effect, which was most prominent for a construct carrying mutations at both cleavage sites flanking the CA domain. Interestingly, co-expression of low amounts of Gag mutated at the CA-SP1 cleavage site also affected processing activity at this site in the wild-type virus. The results indicate that low amounts (<5%) of Gag processing intermediates can display a trans-dominant effect on HIV particle maturation, with the maturation cleavage between CA and SP1 being of particular importance. These effects are likely to be important for the strong activity of PI at concentrations achieved in vivo and also bear relevance for the mechanism of action of the antiviral drug bevirimat.


Figures

FIGURE 1.
FIGURE 1.
A, protease cleavage sites in the HIV Gag and Gag-Pol precursor proteins. Processing at these sites occurs with different rates; sizes of the arrows indicate relative rates of cleavages within Gag (13). B, Gag-derived products from the indicated PR cleavage site mutants used in the experiments shown in Figs. 7 and 8. Gray boxes indicate the respective incompletely processed products.
FIGURE 2.
FIGURE 2.
Effect of low concentrations of HIV PI on virus properties. HIV particles were prepared from NL4-3-infected MT-4 cells incubated at the indicated concentrations of LPV. A and B, influence on Gag processing. Particle lysates were separated by SDS-PAGE (15%; acrylamide/bisacrylamide, 200:1), and Gag-derived proteins were detected (A) and quantified (B) by quantitative immunoblot using polyclonal antiserum against CA. C, infectivity of virus preparations. Virus samples from A were tested for single round infectivity on TZM-bl indicator cells as well as for infectivity on C8166 cells by TCID50 titration. The graphs show relative infectivities normalized to the DMSO control (lane 1 in A) Error bars represent the standard deviation from three different dilutions. Note that relative titers on C8166 cells are plotted on a logarithmic scale although all other sales are linear. D, virus-associated reverse transcriptase. The amount of mature RT in particles (p66 and p51; black bars) in virus preparations from A was determined by quantitative immunoblotting. Particle-associated RT activity (gray bars) was measured in vitro using exogenous substrate. Error bars represent the standard deviation from three different dilutions.
FIGURE 3.
FIGURE 3.
Influence of low concentrations of LPV on particle morphology. HIV-1-infected MT-4 cells were grown in the presence of the indicated concentrations of LPV. Gag processing in particles released into the supernatant was determined by immunoblotting (data not shown). A, infected cells were pelleted, embedded in epoxy resin, and analyzed by thin section EM. Scale bars represent 200 nm. B, proportion of budding structures relative to total viral structures classified. Note that EM analysis is likely to underestimate the number of budding structures, because they may appear as free immature particles depending on their location with respect to the plane of sectioning. C, free virions were classified into immature particles (black bars), mature particles with conical capsid (light gray bars), and particles displaying morphological maturation defects (dark gray bars), and the percentage of particles in each class was calculated relative to the total amount of free particles analyzed. In total, 170–230 viral structures per condition were analyzed.
FIGURE 4.
FIGURE 4.
Effect of suboptimal concentrations of LPV on early steps of HIV replication. A–C, effect on viral entry efficiency on HeLaP4 (A and B) and MT-4 (C) cells. Particles containing the BlaM-Vpr reporter protein, prepared in the presence of the indicated concentrations of LPV, were incubated in triplicate with HeLaP4 cells, and the amount of β-lactamase delivered to the cytoplasm was determined by fluorometry (A) as described previously (22). The plot shows mean values and standard deviation from the triplicate measurements. B, degree of Gag processing was analyzed by immunoblot against CA. C, entry efficiency in MT-4 cells. MT-4 target cells were infected with BlaM-Vpr loaded NL4-3 Env pseudotyped lentiviral vectors produced in the presence of the indicated concentrations of LPV for 4–6 h, washed, and stained overnight with CCF2/AM dye to determine viral entry efficiency. The proportion of cells in which entry had occurred was determined by flow cytometry. The figure shows mean values and standard deviation from triplicate samples from one representative experiment. D, correlation of virion infectivity and late RT products in MT-4 target cells. Late RT products were measured by quantitative PCR on day 1 post-challenge as described previously (27, 28), and the percentage of GFP-positive cells was measured by flow cytometry in the identical cultures on day 3 post-challenge. The graph shows levels of virion infectivity and late RT products of lentiviral vectors produced in the presence of different concentrations of LPV (3–100 nm) normalized to the untreated control from two independent experiments using vesicular stomatitis virus-G pseudotyped particles. Pearson's correlation coefficient R and the corresponding p value were calculated using GraphPad Prism Software.
FIGURE 5.
FIGURE 5.
Influence of partial processing on MA layer stability. A, assay principle. Particles were labeled with a mixture of Gag-embedded eCFP (donor D) and eYFP (acceptor A). Upon proteolytic maturation, the labels remain fused to MA. Detergent disruption of the viral envelope results in dissociation of MA molecules and thereby a loss of the FRET signal, although unprocessed Gag molecules remain associated. B, eCFP/eYFP-labeled particles were prepared from transfected 293T cells grown in the presence of the indicated concentrations of LPV. Particles were incubated at 25 °C and excited at a wavelength of 433 nm. At t = 0, Triton X-100 was added to a final concentration of 0.05%, and emission intensity at 528 nm was recorded over time. Volume-corrected relative fluorescence intensities were normalized to the value recorded before detergent addition.
FIGURE 6.
FIGURE 6.
Interference of low concentrations of PI with cleavage at the NC-SP2 processing site. A, virus was prepared from the supernatant of HeLa cells grown in the presence of the indicated concentrations of LPV. Virus samples were separated by SDS-PAGE on 16.5% Tris-Tricine gels and analyzed by quantitative immunoblotting using the indicated antisera. The positions of NC-SP2 and NC as well as CA-SP1 and CA are marked. B, relative infectivities of the respective virus samples were determined by titration as described previously (47). Data represent mean values and standard deviations from triplicate measurements. The curve shows nonlinear regression to a standard dose-response equation.
FIGURE 7.
FIGURE 7.
Trans-dominant effect of very low amounts of specific intermediate cleavage products. 293T cells were co-transfected with a mixture of pNLC4-3 wild-type and the pNLC4-3 variants carrying mutations at specific PR cleavage sites (see scheme in Fig. 1B). At 44 hours post transfection, supernatants and cells were harvested for analysis. A, fraction of the respective incompletely processed forms relative to total Gag was determined by quantitative immunoblot using the indicated polyclonal antisera. The figure shows immunoblots of tissue culture supernatants from cells transfected with mixtures containing between 0 and 100% of the respective mutated plasmid, as indicated above the lanes. Positions of molecular mass standards are indicated at the left (in kDa). Infectivity of virus preparations was determined by single-round infection of TZM-bl cells (B) and TCID50 titration on C8166 cells (C), respectively. Infectivities per ng of CA were normalized to the value for the wild-type control and plotted against the fraction of total Gag represented by the indicated incompletely processed Gag derivative used for titration. Note that relative titers in C are plotted on a logarithmic scale, and infectivities on TZM-bl cells (B) are plotted on a linear scale.
FIGURE 8.
FIGURE 8.
Incompletely processed Gag molecules impair processing at the CA-SP1 cleavage site. Viral particles were purified from cells co-transfected with a mixture of pNLC4-3 and various relative amounts of pNLC4-3 variants mutated at the respective PR cleavage sites in Gag, which led to the production of MA-NC, CA-NC, or MA-CA, respectively. A, immunoblot detection of cleavage at the CA-SP1 processing site. Cells were co-transfected with a mixture of wild-type pNLC4-3 and between 0 and 100% of the indicated variants, as indicated above the lanes. Gag derivatives containing the CA domain were detected by quantitative immunoblot. B, proportion of CA cleaved at the CA-SP1 processing site was calculated from integrated band intensities from this and analogous experiments and plotted against the integrated band intensities determined for the respective incompletely processed product. Pearson's correlation coefficients R and p values were calculated using GraphPad Prism software.

Similar articles

Cited by

References

    1. Anderson J., Schiffer C., Lee S. K., Swanstrom R. (2009) Handb Exp. Pharmacol. 189, 85–110 - PMC - PubMed
    1. Meek T. D., Lambert D. M., Dreyer G. B., Carr T. J., Tomaszek T. A., Jr., Moore M. L., Strickler J. E., Debouck C., Hyland L. J., Matthews T. J., et al. (1990) Nature 343, 90–92 - PubMed
    1. Lambert D. M., Petteway S. R., Jr., McDanal C. E., Hart T. K., Leary J. J., Dreyer G. B., Meek T. D., Bugelski P. J., Bolognesi D. P., Metcalf B. W., et al. (1992) Antimicrob. Agents Chemother. 36, 982–988 - PMC - PubMed
    1. Murakami T., Ablan S., Freed E. O., Tanaka Y. (2004) J. Virol. 78, 1026–1031 - PMC - PubMed
    1. Wyma D. J., Jiang J., Shi J., Zhou J., Lineberger J. E., Miller M. D., Aiken C. (2004) J. Virol. 78, 3429–3435 - PMC - PubMed

Publication types

MeSH terms

Substances