

Regulated and aberrant glycosylation modulate cardiac electrical signaling
- PMID: 19666501
- PMCID: PMC2752533
- DOI: 10.1073/pnas.0905414106
Regulated and aberrant glycosylation modulate cardiac electrical signaling
Abstract
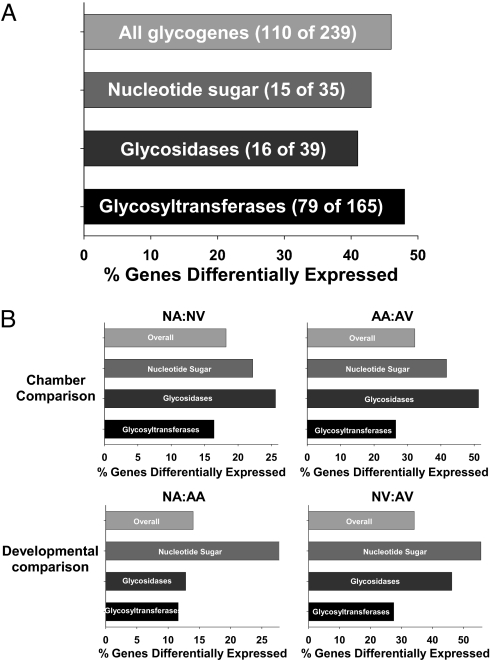
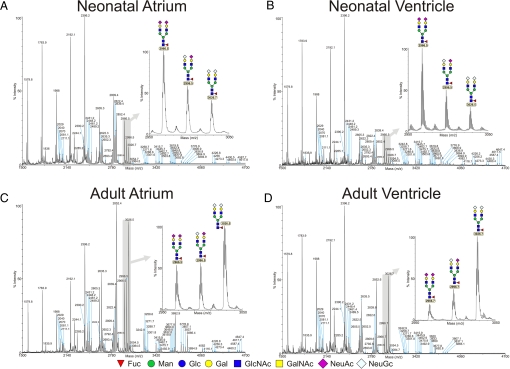
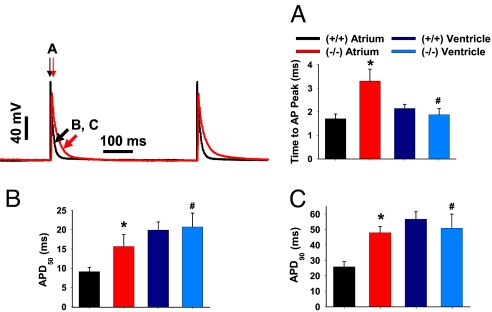
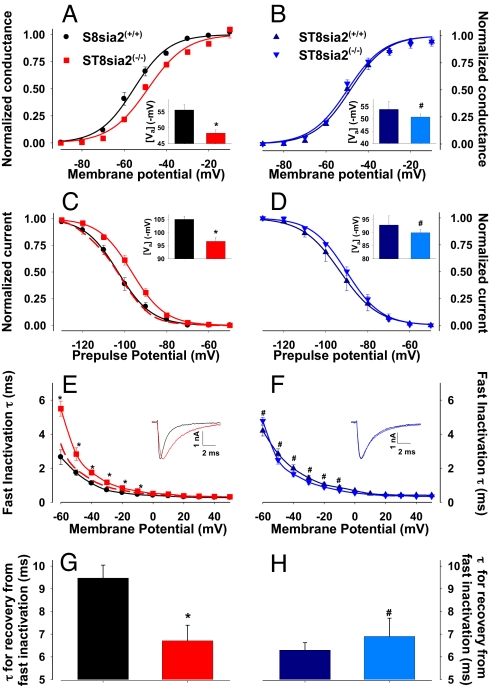
Millions afflicted with Chagas disease and other disorders of aberrant glycosylation suffer symptoms consistent with altered electrical signaling such as arrhythmias, decreased neuronal conduction velocity, and hyporeflexia. Cardiac, neuronal, and muscle electrical signaling is controlled and modulated by changes in voltage-gated ion channel activity that occur through physiological and pathological processes such as development, epilepsy, and cardiomyopathy. Glycans attached to ion channels alter channel activity through isoform-specific mechanisms. Here we show that regulated and aberrant glycosylation modulate cardiac ion channel activity and electrical signaling through a cell-specific mechanism. Data show that nearly half of 239 glycosylation-associated genes (glycogenes) were significantly differentially expressed among neonatal and adult atrial and ventricular myocytes. The N-glycan structures produced among cardiomyocyte types were markedly variable. Thus, the cardiac glycome, defined as the complete set of glycan structures produced in the heart, is remodeled. One glycogene, ST8sia2, a polysialyltransferase, is expressed only in the neonatal atrium. Cardiomyocyte electrical signaling was compared in control and ST8sia2((-/-)) neonatal atrial and ventricular myocytes. Action potential waveforms and gating of less sialylated voltage-gated Na+ channels were altered consistently in ST8sia2((-/-)) atrial myocytes. ST8sia2 expression had no effect on ventricular myocyte excitability. Thus, the regulated (between atrium and ventricle) and aberrant (knockout in the neonatal atrium) expression of a single glycogene was sufficient to modulate cardiomyocyte excitability. A mechanism is described by which cardiac function is controlled and modulated through physiological and pathological processes that involve regulated and aberrant glycosylation.
Conflict of interest statement
The authors declare no conflict of interest.
Figures
Similar articles
-
Expression of the sialyltransferase, ST3Gal4, impacts cardiac voltage-gated sodium channel activity, refractory period and ventricular conduction.J Mol Cell Cardiol. 2013 Jun;59:117-27. doi: 10.1016/j.yjmcc.2013.02.013. Epub 2013 Mar 5. J Mol Cell Cardiol. 2013. PMID: 23471032
-
Reduced hybrid/complex N-glycosylation disrupts cardiac electrical signaling and calcium handling in a model of dilated cardiomyopathy.J Mol Cell Cardiol. 2019 Jul;132:13-23. doi: 10.1016/j.yjmcc.2019.05.001. Epub 2019 May 6. J Mol Cell Cardiol. 2019. PMID: 31071333
-
Differential sialylation modulates voltage-gated Na+ channel gating throughout the developing myocardium.J Gen Physiol. 2006 Mar;127(3):253-65. doi: 10.1085/jgp.200509423. Epub 2006 Feb 13. J Gen Physiol. 2006. PMID: 16476705 Free PMC article.
-
Modulation of voltage-gated ion channels by sialylation.Compr Physiol. 2012 Apr;2(2):1269-301. doi: 10.1002/cphy.c110044. Compr Physiol. 2012. PMID: 23798301 Review.
-
Sodium channel (dys)function and cardiac arrhythmias.Cardiovasc Ther. 2010 Oct;28(5):287-94. doi: 10.1111/j.1755-5922.2010.00210.x. Epub 2010 Jul 14. Cardiovasc Ther. 2010. PMID: 20645984 Review.
Cited by
-
Glia-neuron coupling via a bipartite sialylation pathway promotes neural transmission and stress tolerance in Drosophila.Elife. 2023 Mar 22;12:e78280. doi: 10.7554/eLife.78280. Elife. 2023. PMID: 36946697 Free PMC article.
-
Bacterial toxins and heart function: heat-labile Escherichia coli enterotoxin B promotes changes in cardiac function with possible relevance for sudden cardiac death.Biophys Rev. 2023 Jul 22;15(4):447-473. doi: 10.1007/s12551-023-01100-6. eCollection 2023 Aug. Biophys Rev. 2023. PMID: 37681088 Free PMC article.
-
Simultaneous quantification of N- and O-glycans using a solid-phase method.Nat Protoc. 2017 Jun;12(6):1229-1244. doi: 10.1038/nprot.2017.034. Epub 2017 May 18. Nat Protoc. 2017. PMID: 28518173 Free PMC article.
-
Glycoproteins identified from heart failure and treatment models.Proteomics. 2015 Jan;15(2-3):567-79. doi: 10.1002/pmic.201400151. Epub 2014 Oct 9. Proteomics. 2015. PMID: 25141849 Free PMC article.
-
Chemistry-enabled methods for the visualization of cell-surface glycoproteins in Metazoans.Glycoconj J. 2015 Oct;32(7):443-54. doi: 10.1007/s10719-015-9589-3. Epub 2015 Apr 28. Glycoconj J. 2015. PMID: 25913724 Review.
References
-
- Freeze HH. Genetic defects in the human glycome. Nat Rev Genet. 2006;7:537–551. - PubMed
-
- Ohtsubo K, Marth JD. Glycosylation in cellular mechanisms of health and disease. Cell. 2006;126:855–867. - PubMed
-
- Grandy SA, Trepanier-Boulay V, Fiset C. Postnatal development has a marked effect on ventricular repolarization in mice. Am J Physiol Heart Circ Physiol. 2007;293:H2168–H2177. - PubMed
-
- Plotnikov AN, et al. Cardiac memory evolves with age in association with development of the transient outward current. Circulation. 2004;110:489–495. - PubMed
Publication types
MeSH terms
Substances
LinkOut - more resources
Full Text Sources
Molecular Biology Databases
