. 2009 Aug 11;106(32):13499-504.
doi: 10.1073/pnas.0812080106. Epub 2009 Jul 28.

A Burkholderia pseudomallei protein microarray reveals serodiagnostic and cross-reactive antigens

Affiliations

A Burkholderia pseudomallei protein microarray reveals serodiagnostic and cross-reactive antigens

Philip L Felgner et al. Proc Natl Acad Sci U S A. .

Abstract

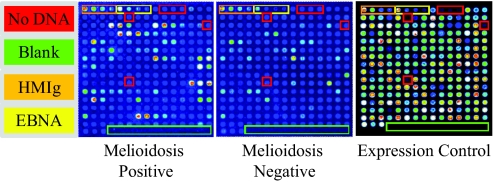
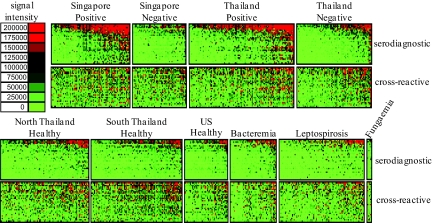
Understanding the way in which the immune system responds to infection is central to the development of vaccines and many diagnostics. To provide insight into this area, we fabricated a protein microarray containing 1,205 Burkholderia pseudomallei proteins, probed it with 88 melioidosis patient sera, and identified 170 reactive antigens. This subset of antigens was printed on a smaller array and probed with a collection of 747 individual sera derived from 10 patient groups including melioidosis patients from Northeast Thailand and Singapore, patients with different infections, healthy individuals from the USA, and from endemic and nonendemic regions of Thailand. We identified 49 antigens that are significantly more reactive in melioidosis patients than healthy people and patients with other types of bacterial infections. We also identified 59 cross-reactive antigens that are equally reactive among all groups, including healthy controls from the USA. Using these results we were able to devise a test that can classify melioidosis positive and negative individuals with sensitivity and specificity of 95% and 83%, respectively, a significant improvement over currently available diagnostic assays. Half of the reactive antigens contained a predicted signal peptide sequence and were classified as outer membrane, surface structures or secreted molecules, and an additional 20% were associated with pathogenicity, adaptation or chaperones. These results show that microarrays allow a more comprehensive analysis of the immune response on an antigen-specific, patient-specific, and population-specific basis, can identify serodiagnostic antigens, and contribute to a more detailed understanding of immunogenicity to this pathogen.


Conflict of interest statement

Conflict of interest statement: P.L.F. and D.H.D. have patent applications related to protein microarray fabrication and have stock positions with Antigen Discovery, Inc. D.M.M. is an employee with Antigen Discovery, Inc.

Figures

Fig. 1.
Fig. 1.
Construction of a B. pseudomallei Microarray. Arrays were printed containing 214 B. pseudomallei proteins, positive and negative control spots. The arrays were read in a laser confocal scanner, analyzed, and the data normalized as described in the Materials and Methods section. Protein expression efficiency was determined to be 99.2% by probing against a carboxy-terminal HA tag for quality control. Each array contains positive control spots printed from 4 serial dilutions of human IgG (HMIg), and the intensity of these spots was similar for both serum samples. Each array also contained 6 “No DNA” negative control spots, and the reactivity of these spots was low for both serum samples. There are also 4 serially diluted EBNA1 (EBNA) protein control spots that are reactive to varying degrees in different subjects, as expected, and provide a methodological control. The remaining spots on the array are in vitro transcription/translation reactions expressing 183 different B. pseudomallei proteins that were selected from our primary array analysis. The signal intensity of each antigen is represented by rainbow palette of blue, green, red, and white by increasing signal intensity. Representative microarray immunofluorescence images of individual patient sera are displayed.
Fig. 2.
Fig. 2.
Probing a collection of B. pseudomallei infected, uninfected, and healthy control sera from Singapore, Thailand, and the USA. Arrays containing 214 B. pseudomallei proteins were probed with 747 melioidosis and nonmelioidosis sera organized into 11 groups as described in the text. The normalized intensity is shown according to the colorized scale with red strongest, bright green weakest, and black in between. The antigens are in rows and are grouped according to serodiagnostic and cross-reactive. The patient samples are in columns and sorted left to right by increasing average intensity to serodiagnostic antigens.
Fig. 3.
Fig. 3.
Serodiagnostic antigen discovery of melioidosis-positive patients from Singapore. The mean sera reactivity of the 214 antigens was compared between the Singapore melioidosis-positive and Singapore melioidosis-negative groups. Antigens with Benjamini Hochberg corrected P value less than 0.05 are organized to the left and cross-reactive antigens to the right. The 31 most reactive serodiagnostic and 31 of the most reactive cross-reactive antigens are shown.
Fig. 4.
Fig. 4.
Development of a melioidosis classifier for improved diagnosis. (A) The graph shows 9 Boxplots for nonlinear classifiers with increasing number of antigens. As the number of antigens increases up to 5 antigens, the classifier becomes more accurate. (B) Ten serodiagnostic antigens were printed onto nitrocellulose paper in adjacent stripes using a BioDot jet dispenser (SI Text). Strips were probed with patient sera diluted 1/200 followed by alkaline phosphatase conjugated secondary antibody and enzyme substrate. Weak reactivity in the naïve healthy controls can be readily distinguished from the strong reactivity in infected subjects. Ten representative strips for each group are shown. (C) The graph shows the immunostrip ROC curves compared to the microarray ROC curve generated for with the same 10 antigens. (D) Percent diagnostic accuracy for each assay is listed. Microarray accuracy was calculated for 1, 2, 5, and 10 antigens. Thailand sera are from a previously well-characterized cohort of patients and represent a selected population of samples with definite melioidosis compared to patients with an alternative diagnosis. Thailand sera samples were used for direct comparison of the microarray, ELISA, IHA, and immunostrip assays.

References

    1. Mayers C, et al. Analysis of known bacterial protein vaccine antigens reveals biased physical properties and amino acid composition. Comp Funct Genomics. 2003;4:468–478. - PMC - PubMed
    1. Rappuoli R. Reverse vaccinology, a genome-based approach to vaccine development. Vaccine. 2001;19:2688–2691. - PubMed
    1. Davies DH, et al. Profiling the humoral immune response to infection by using proteome microarrays: High-throughput vaccine and diagnostic antigen discovery. Proc Natl Acad Sci USA. 2005;102:547–552. - PMC - PubMed
    1. Davies DH, et al. Proteome-wide analysis of the serological response to vaccinia and smallpox. Proteomics. 2007;7:1678–1686. - PubMed
    1. Barbour AG, et al. A genome-wide proteome array reveals a limited set of immunogens in natural infections of humans and white-footed mice with Borrelia burgdorferi. Infect Immun. 2008;76:3374–3389. - PMC - PubMed

Publication types

LinkOut - more resources