. 2009 Aug 18;106(33):14132-7.
doi: 10.1073/pnas.0907134106. Epub 2009 Aug 5.

Small-molecule inhibitors reveal multiple strategies for Hedgehog pathway blockade

Affiliations

Small-molecule inhibitors reveal multiple strategies for Hedgehog pathway blockade

Joel M Hyman et al. Proc Natl Acad Sci U S A. .

Abstract

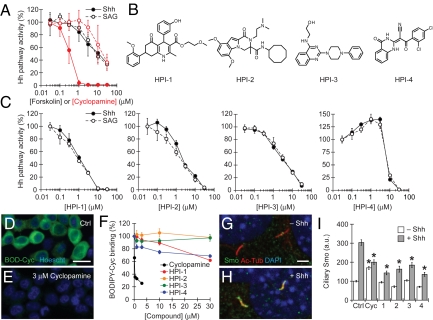
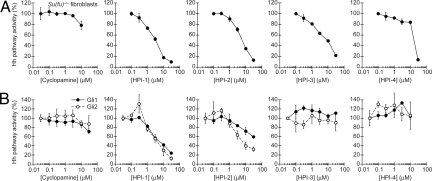
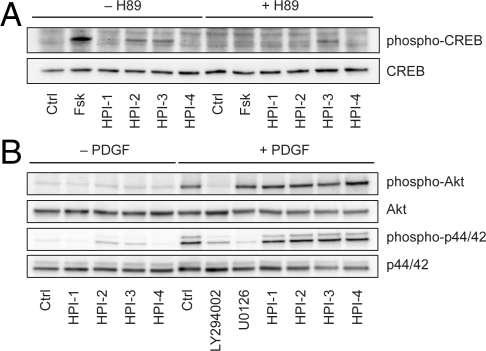
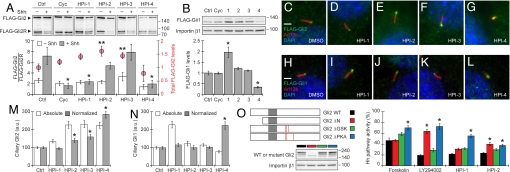
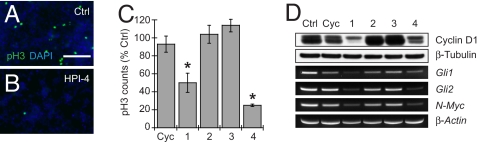
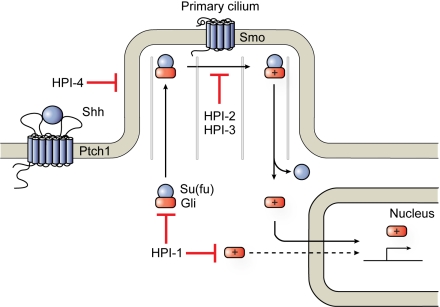
Inappropriate activation of the Hedgehog (Hh) signaling pathway has been implicated in a diverse spectrum of cancers, and its pharmacological blockade has emerged as an anti-tumor strategy. While nearly all known Hh pathway antagonists target the transmembrane protein Smoothened (Smo), small molecules that suppress downstream effectors could more comprehensively remediate Hh pathway-dependent tumors. We report here four Hh pathway antagonists that are epistatic to the nucleocytoplasmic regulator Suppressor of Fused [Su(fu)], including two that can inhibit Hh target gene expression induced by overexpression of the Gli transcription factors. Each inhibitor has a unique mechanism of action, and their phenotypes reveal that Gli processing, Gli activation, and primary cilia formation are pharmacologically targetable. We further establish the ability of certain compounds to block the proliferation of cerebellar granule neuron precursors expressing an oncogenic form of Smo, and we demonstrate that Hh pathway inhibitors can have tissue-specific activities. These antagonists therefore constitute a valuable set of chemical tools for interrogating downstream Hh signaling mechanisms and for developing chemotherapies against Hh pathway-related cancers.


Conflict of interest statement

The authors declare no conflict of interest.

Figures

Fig. 1.
Fig. 1.
Identification of four Hh pathway inhibitors that do not directly target Smo. (A) Activities of cyclopamine (red) and forskolin (black) against Hh pathway activation in Shh-LIGHT2 cells induced by Shh-conditioned medium or 0.5 μM SAG. (B) Chemical structures of the four HPIs. (C) Activities of the HPIs in the Shh-LIGHT2 cell assay. Data are the average of triplicate samples ± SD. (D–F) Effects of cyclopamine and the HPIs on the binding of BODIPY-cyclopamine to Smo-overexpressing HEK 293T cells. Quantitative data are the average BODIPY-cyclopamine intensity from four independent images ± SEM. (G–I) Effects of 3 μM cyclopamine and the HPIs on Shh-dependent accumulation of Smo in the primary cilium. Unless otherwise stated, HPIs doses in all experiments were 10-fold greater than their IC50s in the Shh-LIGHT2 assay or 30 μM, whichever was lower (15 μM HPI-1, 20 μM HPI-2, 30 μM HPI-3, and 30 μM HPI-4). Quantitative data are the average intensity of Smo antibody staining in at least 20 ciliary regions ± SEM. Asterisks indicate P < 0.0001 for ciliary Smo levels associated with each compound treatment vs. the DMSO control. (Scale bars, D: 20 μm; G: 2 μm.)
Fig. 2.
Fig. 2.
Epistatic mapping of HPI activity relative to Su(fu), Gli1, and Gli2. (A) Effects of cyclopamine and the HPIs on Hh pathway activation in Su(fu)−/− fibroblasts. (B) Effects of the Hh pathway inhibitors on Hh pathway activation induced by Gli1 or Gli2 overexpression, as measured using a co-transfected Gli-dependent firefly luciferase reporter. Data are the average of triplicate samples ± SD.
Fig. 3.
Fig. 3.
HPI activity is not due to modulation of PKA, PI3K/Akt, or MAPK signaling. (A) Effects of 50 μM forskolin and the HPIs on PKA activity in NIH 3T3 cells, as determined by the H89-sensitive phosphorylation state of CREB. (B) Effects of the HPIs on PDGF-induced activation of the PI3K/Akt and MAPK signaling pathways in NIH 3T3 cells, as determined by the phosphorylation states of Akt and p44/p42 MAPK. Fifty micromolar LY294002 and 10 μM U0126 were used as positive controls.
Fig. 4.
Fig. 4.
The HPIs differentially perturb Gli processing, stability, localization, and function. (A) Effects of cyclopamine and the HPIs on full-length and repressor forms of FLAG-Gli2 in a clonal NIH 3T3 cell line, including representative immunoblotting results and full-length/repressor ratios (bar graph). Total FLAG-Gli2 levels observed for each compound treatment are also indicated (red circles), normalized with respect to the DMSO control. Data are the average of four independent experiments ± SEM. Asterisks and double asterisks respectively indicate P < 0.03 for full-length/repressor ratios and P < 0.05 for total FLAG-Gli2 levels associated with compound treatment vs. the DMSO control. (B) Effects of the Hh pathway inhibitors on FLAG-Gli1 levels in a clonal NIH 3T3 cell line. Representative immunoblotting results are shown, and quantitative data are the average FLAG-Gli1 levels from three independent experiments ± SEM, normalized with respect to DMSO control. Asterisks indicate P < 0.02 for total FLAG-Gli1 levels associated with compound treatment vs. the DMSO control. (C–G) Subcellular localization of FLAG-Gli2 (green) with respect to the primary cilium (red) and nucleus (blue) in cells treated with DMSO or individual HPIs. (H–L) Subcellular localization of FLAG-Gli1 (green) with respect to the primary cilium (red) and nucleus (blue) in cells under analogous conditions. (M and N) Quantification of ciliary FLAG-Gli2 and FLAG-Gli1 levels associated with HPI treatment. Data are the average intensity of anti-FLAG antibody staining in at least 40 ciliary regions ± SEM, and both absolute ciliary intensities and those normalized with respect to total FLAG-Gli2 or FLAG-Gli1 levels are shown. Asterisks indicate P < 0.003 for normalized ciliary FLAG-Gli levels associated with compound treatment vs. the DMSO control. (O) Differential inhibition of wildtype (black), ΔN (red), ΔGSK (green) and ΔPKA (blue) forms of Gli2 by 50 μM forskolin, 50 μM LY294002, HPI-1, or HPI-2. Wild-type and mutant forms of Gli2 are depicted schematically with the DNA-binding zinc finger region shown in gray and mutated phosphorylation sites shown in red. Immunoblotting data for each Gli2 construct are also shown to confirm protein expression levels. Hh pathway activities are expressed relative to those observed for each Gli2 form in the absence of compound and are the average of nine replicates ± SEM. Asterisks indicate P < 0.002 and greater than a 1.5-fold change for Hh pathway activities associated with mutant vs. wildtype Gli2 expression in the presence of compound. (Scale bars, 2 μm.)
Fig. 5.
Fig. 5.
Pharmacological blockade of SmoM2-dependent CGNP proliferation. (A and B) Representative anti-pH3 staining of primary CGNP cultures treated with DMSO or individual HPIs. (Scale bar, 100 μm.) (C) Quantification of pH3-positive cells upon cyclopamine (Cyc; 5 μM) or HPI treatment (20 μM each), relative to a DMSO control. Data are the average of at least two independent experiments ± SEM. Asterisks indicate P < 0.0005 for pH3 counts associated with HPI-1 or HPI-4 treatment vs. cyclopamine, HPI-2, and HPI-3. (D) Effects of cyclopamine and the HPIs on cyclin D1, Gli1, Gli2, and N-Myc expression, relative to β-tubulin and β-actin controls.
Fig. 6.
Fig. 6.
Graphical representation of the Hh signaling pathway in its activated state and possible sites of HPI action. HPI-1 inhibits both endogenous (solid arrows) and exogenous (dashed arrow) Gli1/Gli2 activity, suggesting that it acts independently of the primary cilium. HPI-2 and HPI-3 appear to block the conversion of full-length Gli2 proteins into transcriptional activators, and HPI-4 disrupts ciliogenesis and therefore ciliary processes required for Gli function.

References

    1. Jiang J, Hui CC. Hedgehog signaling in development and cancer. Dev Cell. 2008;15:801–812. - PMC - PubMed
    1. Echelard Y, et al. Sonic hedgehog, a member of a family of putative signaling molecules, is implicated in the regulation of CNS polarity. Cell. 1993;75:1417–1430. - PubMed
    1. Goodrich LV, Johnson RL, Milenkovic L, McMahon JA, Scott MP. Conservation of the hedgehog/patched signaling pathway from flies to mice: Induction of a mouse patched gene by Hedgehog. Genes Dev. 1996;10:301–312. - PubMed
    1. Stone DM, et al. The tumour-suppressor gene patched encodes a candidate receptor for Sonic hedgehog. Nature. 1996;384:129–134. - PubMed
    1. Akiyama H, et al. Cloning of a mouse smoothened cDNA and expression patterns of hedgehog signalling molecules during chondrogenesis and cartilage differentiation in clonal mouse EC cells, ATDC5. Biochem Biophys Res Commun. 1997;235:142–147. - PubMed

Publication types

Substances

LinkOut - more resources