. 2009 Aug 11;106(32):13511-6.
doi: 10.1073/pnas.0813327106. Epub 2009 Jul 28.

Multiplexed imaging of surface enhanced Raman scattering nanotags in living mice using noninvasive Raman spectroscopy

Affiliations

Multiplexed imaging of surface enhanced Raman scattering nanotags in living mice using noninvasive Raman spectroscopy

Cristina L Zavaleta et al. Proc Natl Acad Sci U S A. .

Abstract

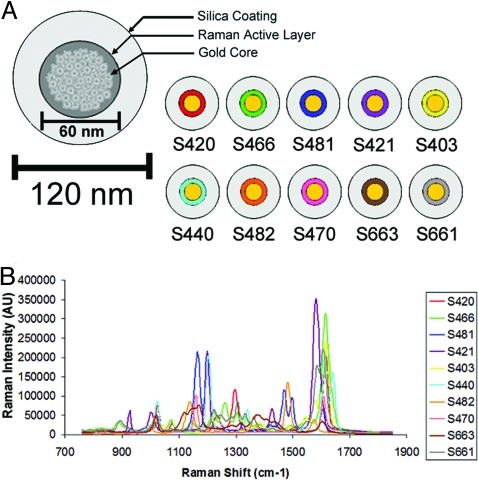
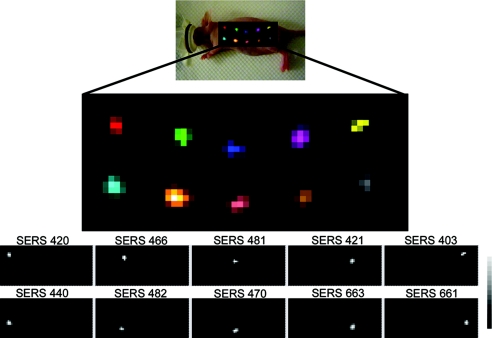
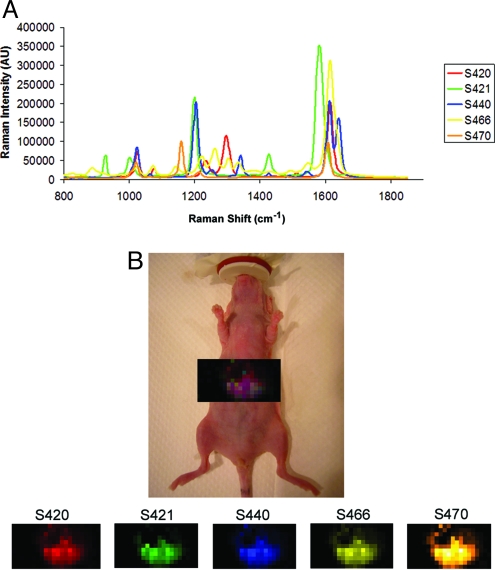
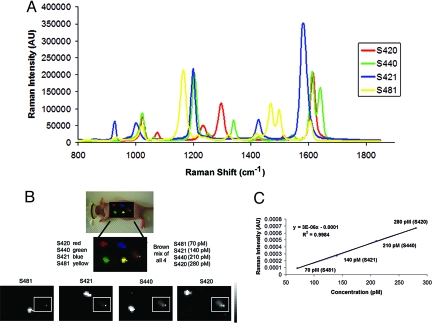
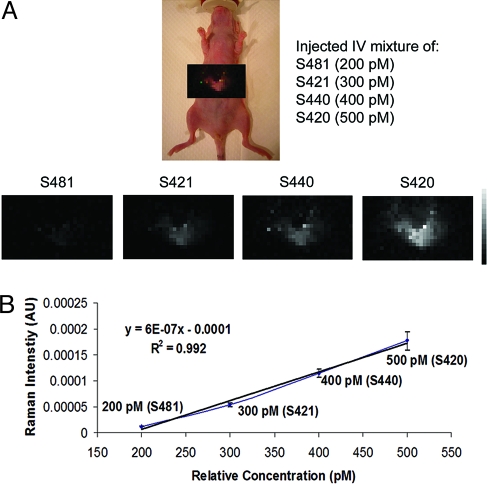
Raman spectroscopy is a newly developed, noninvasive preclinical imaging technique that offers picomolar sensitivity and multiplexing capabilities to the field of molecular imaging. In this study, we demonstrate the ability of Raman spectroscopy to separate the spectral fingerprints of up to 10 different types of surface enhanced Raman scattering (SERS) nanoparticles in a living mouse after s.c. injection. Based on these spectral results, we simultaneously injected the five most intense and spectrally unique SERS nanoparticles i.v. to image their natural accumulation in the liver. All five types of SERS nanoparticles were successfully identified and spectrally separated using our optimized noninvasive Raman imaging system. In addition, we were able to linearly correlate Raman signal with SERS concentration after injecting four spectrally unique SERS nanoparticles either s.c. (R(2) = 0.998) or i.v. (R(2) = 0.992). These results show great potential for multiplexed imaging in living subjects in cases in which several targeted SERS probes could offer better detection of multiple biomarkers associated with a specific disease.


Conflict of interest statement

The authors declare no conflict of interest.

Figures

Fig. 1.
Fig. 1.
Schematic representation of a SERS Raman nanoparticle and graph depicting unique Raman spectra associated with each of the 10 SERS nanoparticles used for in vivo multiplexed imaging. (A) Schematic of a SERS Raman nanoparticle consisting of a 60-nm gold core with a unique Raman active layer adsorbed onto the gold surface and coated with glass totaling 120 nm in diameter. The trade name of each SERS nanoparticle is depicted to the right, where a color has been assigned to the Raman active layer of each SERS nanoparticle. (B) Graph depicting Raman spectra of all 10 SERS nanoparticles; each spectra has been assigned a color corresponding to its unique Raman active layer as shown in (A).
Fig. 2.
Fig. 2.
Evaluation of multiplexing 10 different SERS nanoparticles in vivo. Raman map of 10 different SERS particles injected s.c. in a nude mouse. Arbitrary colors have been assigned to each unique SERS nanoparticle batch injected. Panels below depict separate channels associated with each of the injected SERS nanoparticles (S420, S466, S481, S421, S403, S440, S482, S470, S663, and S661, respectively). Grayscale bar to the right depicts the Raman intensity, where white represents the maximum intensity and black represents no intensity. The postprocessing software was able to successfully separate all 10 SERS nanoparticles into their respective channels with minimal crosstalk.
Fig. 3.
Fig. 3.
Demonstration of deep-tissue multiplexed imaging 24 h after i.v. injection of five unique SERS nanoparticle batches simultaneously. (A) Graph depicting five unique Raman spectra, each associated with its own SERS batch: S420 (red), S421 (green), S440 (blue), S466 (yellow), and S470 (orange). It is noteworthy that their peaks have very little spectral overlap, allowing easier spectral unmixing and resulting in better deep-tissue detection. (B) Raman image of liver overlaid on digital photo of mouse, showing accumulation of all five SERS batches accumulating in the liver after 24 h post i.v. injection. Panels below depict separate channels associated with each of the injected SERS nanoparticle batches. Individual colors have been assigned to each channel, and the resulting mixture shows a purple color that represents a mixture of the five SERS nanoparticle batches accumulating simultaneously. It should be noted that all channels show accumulation in the liver; however the channels are not all homogenous in their distribution throughout the liver.
Fig. 4.
Fig. 4.
Evaluation of multiplexing various concentrations of SERS nanoparticles in s.c. injection model. (A) Graph depicting four unique Raman spectra, each associated with its own SERS batch (S420, S440, S421, and S481). It may be noted that their peaks have very little spectral overlap, and their maximum Raman intensities are all fairly similar which makes them ideal for evaluating various concentrations of different SERS flavors. (B) Raman image depicting multiplexing various concentrations of SERS nanoparticles after s.c. injection. Upper shows a Raman map of four different SERS particles injected s.c., each assigned a separate color: red for S420, green for S440, blue for S421, and yellow for S481. The fifth s.c. injection, represented by a brown color at the far right, is a mixture of the four unique SERS batches of varying concentrations. Lower shows separate channels in which each of the individual SERS bathes were detected. Grayscale bar to the right depicts the Raman intensity, where white represents the maximum intensity and black represents no intensity. All s.c. injections were correctly identified. It may be noted that the fifth s.c. mixture (in white box) becomes visually more intense as the concentration of SERS nanoparticles increases, allowing one to qualitatively determine which SERS nanoparticle batch is more prevalent in the mixture, from least to most. (C) This graph represents a more quantitative assessment of how the Raman intensity taken directly from the Raman images is linearly related to the SERS concentration injected in the mixture.
Fig. 5.
Fig. 5.
Evaluation of multiplexing various concentrations of SERS nanoparticles in a deep-tissue model. (A) Raman map of the entire liver taken 2 h post i.v. injection containing a mixture of four unique SERS batches of varying concentrations (200 pM of S481, 300 pM of S421, 400 pM of S440, and 500 pM of S420). Bottom shows separate channels in which each of the individual SERS bathes were detected. Grayscale bar to the right depicts the Raman intensity, where white represents the maximum intensity and black represents no intensity. Liver images reveal a consistent pattern with the concentration of SERS nanoparticles injected; as the concentration of SERS nanoparticles injected increased, the Raman intensity on the Raman maps increased. It may be noted that the liver images become more intense or visible with increased SERS concentration injected, allowing a correct qualitative assessment of which SERS nanoparticle batch is more prevalent in the mixture, from least to most. (B) This graph represents a more quantitative assessment of how the Raman intensity taken directly from the Raman images is linearly related to the SERS concentration injected in the mixture (n = 3; error bars represent standard deviation).

References

    1. Xing Y, et al. Bioconjugated quantum dots for multiplexed and quantitative immunohistochemistry. Nat Protoc. 2007;2:1152–1165. - PubMed
    1. Young SH, Rozengurt E. Qdot nanocrystal conjugates conjugated to bombesin or ANG II label the cognate G protein-coupled receptor in living cells. Am J Physiol. 2006;290:C728–C732. - PubMed
    1. Kim JH, et al. Nanoparticle probes with surface enhanced Raman spectroscopic tags for cellular cancer targeting. Anal Chem. 2006;78:6967–6973. - PubMed
    1. Chan WC, Maxwell DJ, Gao X, Bailey RE, Han M, Nie S. Luminescent quantum dots for multiplexed biological detection and imaging. Curr Opin Biotechnol. 2002;13:40–46. - PubMed
    1. Sun L, Yu C, Irudayaraj J. Surface-enhanced Raman scattering based nonfluorescent probe for multiplex DNA detection. Anal Chem. 2007;79:3981–3988. - PMC - PubMed

Publication types