. 2009 Aug 11;106(32):13393-8.
doi: 10.1073/pnas.0903682106. Epub 2009 Aug 3.

Perturbations to trophic interactions and the stability of complex food webs

Affiliations

Perturbations to trophic interactions and the stability of complex food webs

Eoin J O'Gorman et al. Proc Natl Acad Sci U S A. .

Abstract

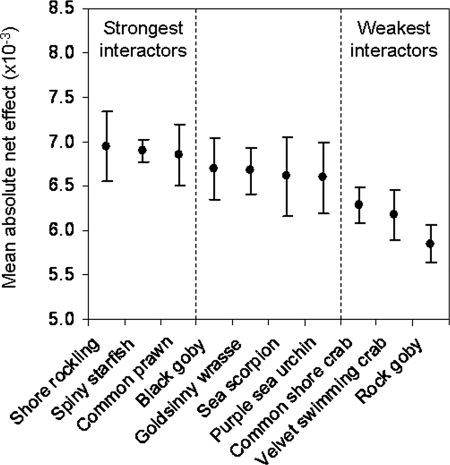
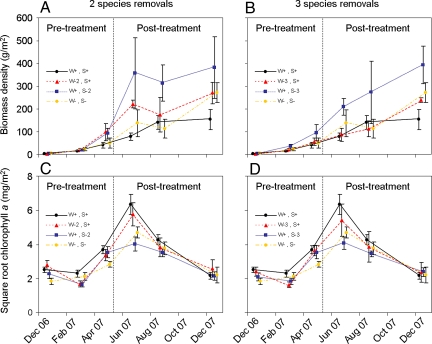
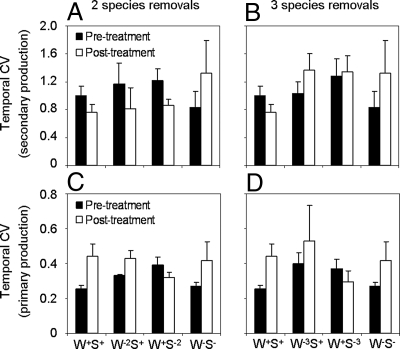
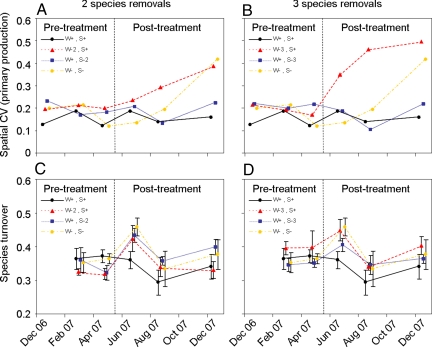
The pattern of predator-prey interactions is thought to be a key determinant of ecosystem processes and stability. Complex ecological networks are characterized by distributions of interaction strengths that are highly skewed, with many weak and few strong interactors present. Theory suggests that this pattern promotes stability as weak interactors dampen the destabilizing potential of strong interactors. Here, we present an experimental test of this hypothesis and provide empirical evidence that the loss of weak interactors can destabilize communities in nature. We ranked 10 marine consumer species by the strength of their trophic interactions. We removed the strongest and weakest of these interactors from experimental food webs containing >100 species. Extinction of strong interactors produced a dramatic trophic cascade and reduced the temporal stability of key ecosystem process rates, community diversity and resistance to changes in community composition. Loss of weak interactors also proved damaging for our experimental ecosystems, leading to reductions in the temporal and spatial stability of ecosystem process rates, community diversity, and resistance. These results highlight the importance of conserving species to maintain the stabilizing pattern of trophic interactions in nature, even if they are perceived to have weak effects in the system.


Conflict of interest statement

The authors declare no conflict of interest.

Figures

Fig. 1.
Fig. 1.
Categorisation of 10 marine consumers as strong or weak interactors. The mean absolute net effect (± SEM) of the 10 manipulated species on the rest of the mesocosm communities was measured by using the dynamic index (10). We chose the 3 strongest and 3 weakest interactors for manipulation in the final phase of the experiment.
Fig. 2.
Fig. 2.
Ecosystem process rates in the experiment. Levels of secondary production (A and B) and primary production (C and D) in the experimental mesocosms (± SEM) at each of 6 different sampling sessions. Three of these sessions occurred before the interaction strength manipulation (pretreatment) and 3 after (posttreatment). In the key, W+S+ = an intact community; W−2S+ = 2 weakest interactors removed; W−3S+ = 3 weakest interactors removed; W+S−2 = 2 strongest interactors removed; W+S−3 = 3 strongest interactors removed; and WS = all strong and weak interactors removed. Data were transformed for statistical analyses, but original values are shown here for clarity.
Fig. 3.
Fig. 3.
Temporal stability effects in the experiment. These effects were measured as the coefficient of temporal variation (temporal CV; ± SEM) of secondary production (A and B) and primary production (C and D). Black bars indicate that stability effects precede the interaction strength manipulation (pretreatment); white bars indicate that stability effects occur after the manipulation (posttreatment). W+S+ = an intact community; W−2S+ = 2 weakest interactors removed; W−3S+ = 3 weakest interactors removed; W+S−2 = 2 strongest interactors removed; W+S−3 = 3 strongest interactors removed; and WS = all strong and weak interactors removed. Data were transformed for statistical analyses, but original values are shown here for clarity.
Fig. 4.
Fig. 4.
Spatial stability and resistance of the mesocosm communities. (A and B) Spatial stability effects in the experiment, measured as the coefficient of spatial variation (spatial CV) of primary production. Each data point represents a single measure calculated across the replicates within each treatment. Therefore, no y axis error bars are included in the plot. (C and D) Resistance of the experimental mesocosm communities to invasions and extinctions, measured as the species turnover (beta diversity) between consecutive sampling sessions. The first sampling session took place in December 2006, so there is no comparison for species turnover in this month. In the key, W+S+ = an intact community; W−2S+ = 2 weakest interactors removed; W−3S+ = 3 weakest interactors removed; W+S−2 = 2 strongest interactors removed; W+S−3 = 3 strongest interactors removed; and WS = all strong and weak interactors removed.

References

    1. Elton CS. Ecology of Invasions by Animals and Plants. London: Chapman & Hall; 1958.
    1. May RM. Stability and Complexity in Model Ecosystems. Princeton: Princeton Univ Press; 1973. - PubMed
    1. McCann KS. The diversity–stability debate. Nature. 2000;405:228–233. - PubMed
    1. Pimm SL, Lawton JH. Feeding on more than one trophic level. Nature. 1978;275:542–544.
    1. Brose U, Williams RJ, Martinez ND. Allometric scaling enhances stability in complex food webs. Ecol Lett. 2006;9:1228–1236. - PubMed

Publication types