. 2009 Oct;297(4):H1319-28.
doi: 10.1152/ajpheart.00039.2009. Epub 2009 Aug 7.

Phasic contractions of rat mesenteric lymphatics increase basal and phasic nitric oxide generation in vivo

Affiliations

Phasic contractions of rat mesenteric lymphatics increase basal and phasic nitric oxide generation in vivo

H Glenn Bohlen et al. Am J Physiol Heart Circ Physiol. 2009 Oct.

Abstract

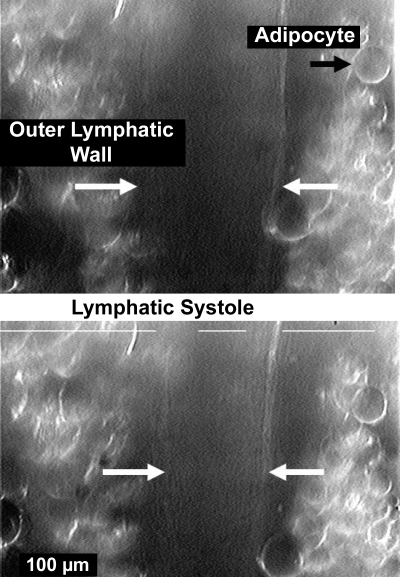
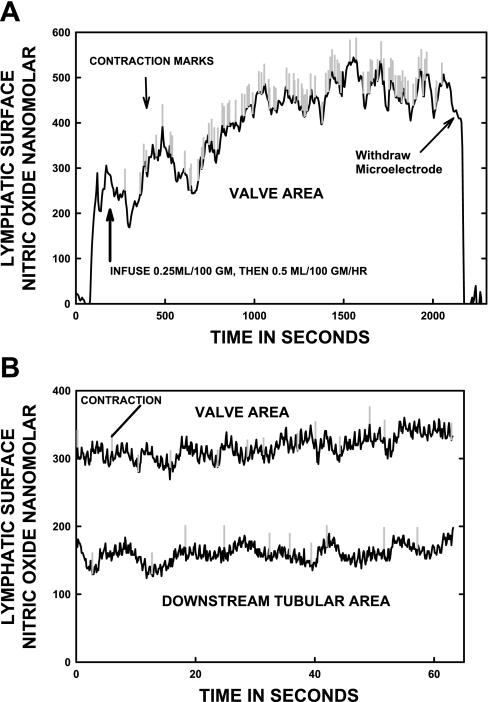
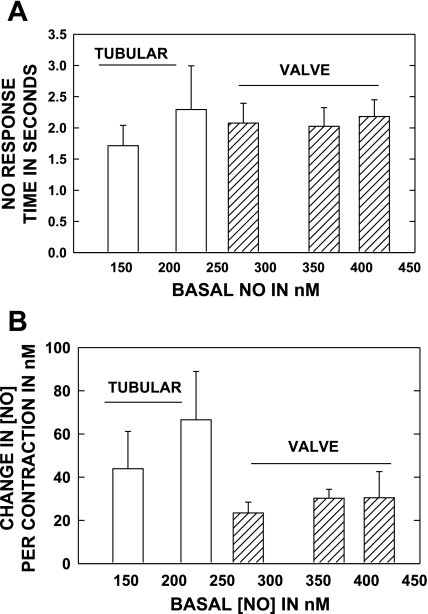
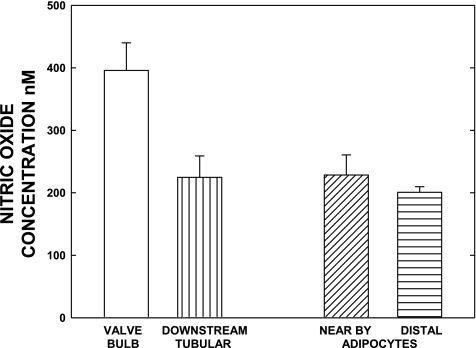
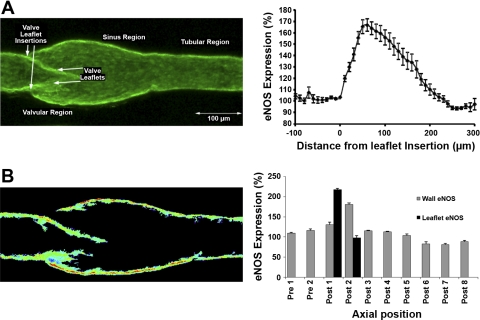
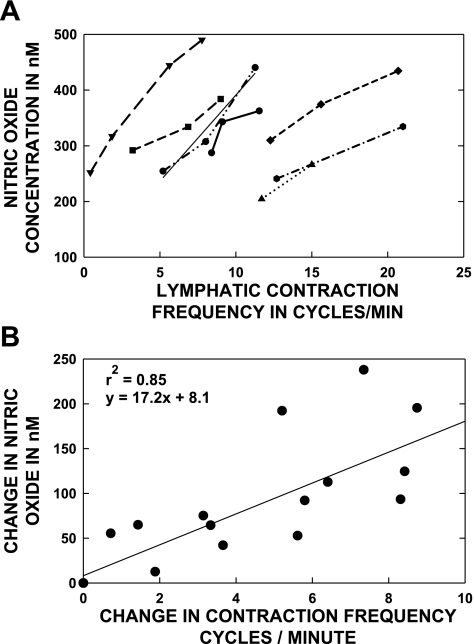
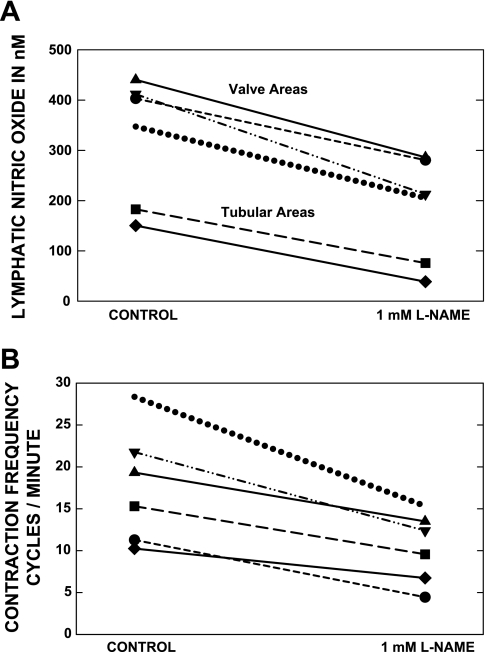
Multiple investigators have shown interdependence of lymphatic contractions on nitric oxide (NO) activity by pharmacological and traumatic suppression of endothelial NO synthase (eNOS). We demonstrated that lymphatic diastolic relaxation is particularly sensitive to NO from the lymphatic endothelium. The predicted mechanism is shear forces produced by the lymph flow during phasic pumping, activating eNOS in the lymphatic endothelium to produce NO. We measured [NO] during phasic contractions using microelectrodes on in situ mesenteric lymphatics in anesthetized rats under basal conditions and with an intravenous saline bolus (0.5 ml/100 g) or infusion (0.5 ml x 100 g(-1) x h(-1)). Under basal conditions, [NO] measured on the tubular portions of the lymphatics was approximately 200-250 nM, slightly higher than in the adjacent adipocyte microvasculature, whereas [NO] measured on the lymphatic bulb surface was approximately 400 nM. Immunohistochemistry of eNOS in isolated lympathics indicated a much greater expression in the lymph valves and surrounding bulb area than in the tubular regions. During phasic lymphatic contractions, the valve and tubular [NO] increased with each contraction, and during intravenous saline infusion, [NO] increased in proportion to the contraction frequency and, presumably, lymph flow. The partial blockade of eNOS over approximately 1 cm length with N(omega)-nitro-L-arginine methyl ester lowered the [NO]. These in vivo data document for the first time that both valvular and tubular lymphatic segments increase NO generation during each phasic contraction and that [NO] summated with increased contraction frequency. The combined data predict regional variations in eNOS and [NO] in the tubular and valve areas, plus the summated NO responses dependent on contraction frequency provide for a complex relaxation mechanism involving NO.


Figures

Fig. 1.
Fig. 1.
A video image of an intact, in vivo lymphatic in diastole (top) and at full systole (bottom). The mesenteric lymphatic vessels associated with major mesenteric arteries are virtually surrounded by adipocytes, and the exact inner diameter locations are difficult to resolve. The white broken line along the top of each image was generated by the Living Systems Dimension Analyzer and is part of an automated system to track changes in dimensions, in this case, the edges of adipocytes adhered to the lymphatic. Normally, the 2 longer lines would terminate before crossing over the outer walls of the lymphatic. The limited contrast of the images, despite oblique lighting and modification of the image with the camera controls, made simultaneous measurements of both wall locations and thereby diameter difficult. However, 1 of the 2 measurement windows did consistently track motion to allow the start of systole to be accurately determined.
Fig. 2.
Fig. 2.
A: a typical long-term recording of nitric oxide concentration [NO] at a slow speed (1 point/5 s) as a vessel responded to saline infusion. The recording shown is over more than 30 min. The vertical marks are individual contractions, and their decreasing spacing indicates increased frequency of contractions after the infusion of saline to augment lymph production by the small intestine. B: [NO] recorded at high speed (10 points/s) in the valvular and tubular area of the same lymph vessel measured after saline infusion. The smaller variations in [NO] in B are artifacts of the 70 breathes/min ventilation of the animal. In A and B, the larger variations in [NO] that start at or near vertical marks are excursions of [NO] with each lymphatic contraction.
Fig. 3.
Fig. 3.
A: the response time of the [NO] from basal to peak during single lymphatic contraction cycle is shown for tubular and valve areas. Both regions have fast NO responses during contractions. The data were collected at basal conditions and as lymphatic activity increased during saline infusion. This allowed the comparison of timed and NO responses to the average [NO] in A and B. B: the increase in [NO] from basal to peak of contraction for the same vessels and conditions as in A. Tubular areas are able to generate as large an increase in NO per contraction as are valvular areas. Data set based on 6 tubular (6 rats) and 7 valve (7 rats) areas.
Fig. 4.
Fig. 4.
Paired valvular and tubular area [NO] of lymphatics during stable activity shortly after bolus saline infusion are shown along with measurements of adipocyte [NO] one cell distance (20–30 um) from the lymph wall and 500 μm from the wall. The lymphatic wall concentrations used are those between successive contractions, which are lower than during the height of the contraction. The high [NO] of the adipocyte tissue, presumably generated by their microvascular network, was equivalent to the [NO] found basally in the tubular lymphatic regions. The lymphatic valvular areas did consistently have a much higher [NO] than either the [NO] found in adipose tissue or tubular regions of the lymphatic. The data set is based on measurements of 12 lymphatics and associated adipose tissues in 10 rats.
Fig. 5.
Fig. 5.
A: the expression of endothelial NO synthase (eNOS) was measured by immunofluorescence histochemistry using isolated rat mesenteric lymphatic vessels and confocal microscopy. A, left: a typical complete reconstruction of the three-dimensional eNOS expression depicting the labeling in the lymphatic endothelium of the valvular, sinus, valve leaflets, and tubular regions. A, right: the integrated fluorescence intensity of eNOS rose in the valvular region of the lymphatic starting about the upstream point of insertion of the lymphatic valves (n = 18 vessels from different animals, bars = means ± SE). The relative eNOS expression then declined in the downstream axial direction of the lymphatic sinus beyond the valve leaflets. B, left: a typical reconstruction of the middle quarter of the scanned vessel cutting through the lymphatic wall and valve at 90° to the points of leaflets downstream insertion. The image was background subtracted and color coded to represent relative eNOS expression spectrally with higher expression being hotter colors. The normalized eNOS expression was then integrated over axial sections of the vessel (binned in 25–30 μm long-axial sections) and plotted in the bar graph (n = 6 vessels from different animals, bars = means ± SE) (B, right).
Fig. 6.
Fig. 6.
The contraction frequency and [NO] was measured during basal lymphatic activity at the beginning of the experiment and at various times after infusion of saline. Each line in A is for a different animal (N = 7). Note that considerable variability of contraction frequency existed for the basal activity at the beginning of each experiment, but the [NO] range is not as variable. Saline infusion was used to elevate lymphatic activity and also increased both [NO] and contraction frequency in every case. The slope of the contraction frequency vs. [NO] was similar between animals, and the data are plotted as change in contraction frequency vs. change in [NO] in B. The data set fit a straight line with a high correlation coefficient and may indicate a relatively common [NO] vs. contraction frequency, i.e., flow mechanism, between lymph vessels.
Fig. 7.
Fig. 7.
A and B: (l-name) was used to partially suppress eNOS in a small section of an activated lymphatic to demonstrate that [NO] declined as would be expected and to evaluate the change in contraction frequency. In B, a decrease in contraction frequency with partial eNOS suppression is consistently shown. After application of l-NAME, the [NO] had decreased significantly (P < 0.01) to 50.6 ± 7.6% of control and the frequency of contractions had decreased significantly (P < 0.04) to 61.9+3.6% of control.

References

    1. Bauser-Heaton HD, Bohlen HG. Cerebral microvascular dilation during hypotension and decreased oxygen tension: a role for nNOS. Am J Physiol Heart Circ Physiol 293: H2193–H2201, 2007 - PubMed
    1. Bauser-Heaton HD, Song J, Bohlen HG. Cerebral microvascular nNOS responds to lowered oxygen tension through a bumetanide-sensitive cotransporter and sodium-calcium exchanger. Am J Physiol Heart Circ Physiol 294: H2166–H2173, 2008 - PubMed
    1. Benoit JN, Zawieja DC. Effects of f-Met-Leu-Phe-induced inflammation on intestinal lymph flow and lymphatic pump behavior. Am J Physiol Gastrointest Liver Physiol 262: G199–G202, 1992 - PubMed
    1. Benoit JN, Zawieja DC, Goodman AH, Granger HJ. Characterization of intact mesenteric lymphatic pump and its responsiveness to acute edemagenic stress. Am J Physiol Heart Circ Physiol 257: H2059–H2069, 1989 - PubMed
    1. Bohlen HG. Intestinal mucosal oxygenation influences absorptive hyperemia. Am J Physiol Heart Circ Physiol 239: H489–H493, 1980 - PubMed

Publication types

MeSH terms

LinkOut - more resources