. 2009 Oct 8;114(15):3208-15.
doi: 10.1182/blood-2009-02-203042. Epub 2009 Aug 7.

Severe loss of invariant NKT cells exhibiting anti-HTLV-1 activity in patients with HTLV-1-associated disorders

Affiliations

Severe loss of invariant NKT cells exhibiting anti-HTLV-1 activity in patients with HTLV-1-associated disorders

Kazuko Azakami et al. Blood. .

Abstract

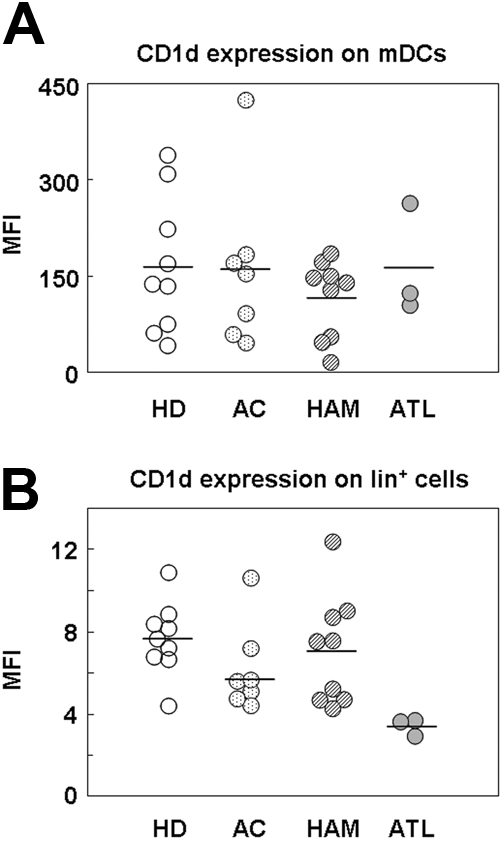
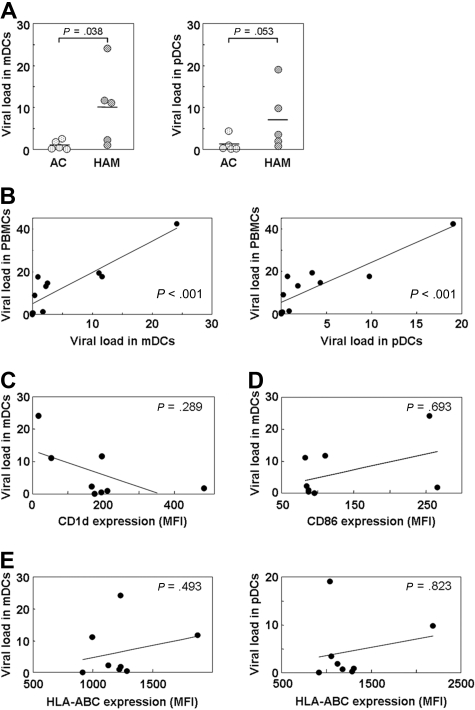
Invariant natural killer T (iNKT) cells are unique T cells that regulate the immune response to microbes, cancers, and autoimmunity. We assessed the characteristics of iNKT cells from persons infected with human T-lymphotropic virus type 1 (HTLV-1). Whereas most infected persons remain asymptomatic carriers (ACs) throughout their lives, a small proportion, usually with high equilibrium proviral loads,develop 2 diseases: HTLV-1-associated myelopathy/tropical spastic paraparesis (HAM/TSP) and adult T-cell leukemia (ATL). We demonstrated that the frequency of iNKT, NK, and dendritic cells in the peripheral blood of HAM/TSP and ATL patients is decreased. We also observed an inverse correlation between the iNKT cell frequency and the HTLV-1 proviral load in the peripheral blood of infected persons. Notably, in vitro stimulation of peripheral blood cells with alpha-galactosylceramide led to an increase in the iNKT cell number and a subsequent decrease in the HTLV-1-infected T-cell number in samples from ACs but not HAM/TSP or ATL patients. Our results suggest that iNKT cells contribute to the immune defense against HTLV-1, and iNKT-cell depletion plays an important role in the pathogenesis of HAM/TSP and ATL. Therefore, iNKT cell-based immunotherapy may be an effective strategy for preventing these HTLV-1-associated disorders.


Figures

Figure 1
Figure 1
Decreased frequency of iNKT and NK cells, mDCs, and pDCs among PBMCs from HAM/TSP and ATL patients. (A) Representative FACS plot of iNKT cells from HDs, ACs, HAM/TSP patients (HAM), and ATL patients. PBMCs were stained for CD3 and Vα24Jα18, and the expression of CD3 and Vα24Jα18 is plotted. Numbers adjacent to the outlined area indicate the percentage of iNKT cells in total PBMCs. Plots of the frequency of iNKT cells (B), CD56+CD16+ NK cells (C), mDCs (D), and pDCs (E) among PBMCs from 12 HDs, 12 ACs, 13 HAM/TSP patients, and 11 ATL patients. The horizontal bar represents the mean value for each group. Scheffé F test was used for statistical analysis. Statistically significant differences: *P < .05, **P < .01.
Figure 2
Figure 2
Inverse correlation between the frequency of iNKT cells and the proviral load in peripheral blood from HTLV-1–infected persons. The correlation between the HTLV-1 proviral load in PBMCs and the frequency of iNKT cells (A), CD56+CD16+ NK cells (B), mDCs (C), and pDCs (D) from HTLV-1–infected persons (ACs, n = 12; HAM/TSP patients, n = 13) was statistically analyzed using the Spearman rank correlation test.
Figure 3
Figure 3
Equivalent expression levels of CD1d on mDCs and lineage-positive (Lin+) cells from HDs, ACs, and HAM/TSP patients, and ATL patients. Plots of the expression level (mean fluorescence intensity [MFI]) of CD1d molecules on mDCs (A) and Lin+ cells (B) among PBMCs from HDs (n = 9), ACs (n = 7), HAM/TSP patients (n = 9), and ATL patients (n = 3). The horizontal bar represents the mean value for each group. Statistical analysis of the expression level for each study subject revealed no statistically significant differences by 1-way analysis of variance and Scheffé F test.
Figure 4
Figure 4
Increased HTLV-1 proviral load in DCs of HAM/TSP patients not associated with CD1d expression level. (A) The HTLV-1 proviral load was higher in mDCs (P = .038) and pDCs (P = .053) of HAM/TSP patients (n = 5) than in those of ACs (n = 5). The Mann-Whitney U test was used for statistical analysis. (B) Correlation analysis of the proviral load in PBMCs of HTLV-1–infected persons (5 ACs and 5 HAM/TSP patients) and that in mDCs (P < .001) and pDCs (P < .001) using Spearman rank correlation test. (C-E) No correlation was found between the proviral load in mDCs or pDCs of HTLV-1–infected persons (3 ACs and 5 HAM/TSP patients) and the expression level of CD1d on mDCs (P = .289; C), CD86 on mDCs (P = .693; D), and HLA-ABC on mDCs (P = .493) and pDCs (P = .823; E) by Spearman rank correlation test.
Figure 5
Figure 5
Expansion of iNKT cells by α-GalCer stimulation decreased the number of HTLV-1–infected T cells in ACs but not in HAM/TSP and ATL patients. (A) PBMCs from ACs (n = 6) and HAM/TSP (n = 11) and ATL patients (n = 5) were cultured with α-GalCer (100 ng/mL), and the percentage of iNKT cells on days 0, 7, 14, and 21 was plotted. (B) PBMCs from ACs (n = 6) and HAM/TSP (n = 11) and ATL patients (n = 4) were cultured for 14 days with or without α-GalCer, and the proviral load in each sample was quantified by real-time PCR. In ACs, the proviral load in PBMCs cultured with α-GalCer was significantly lower than that of cultured PBMCs grown without α-GalCer (P = .047). No significant difference was observed between HAM/TSP (P = .718) and ATL (P = .298) patients. Wilcoxon signed-rank test was used for statistical analysis.
Figure 6
Figure 6
iNKT cells impaired in proliferation and perforin production are partially infected with HTLV-1 and CD4 iNKT cells are depleted in HTLV-1–infected persons. (A) Proliferative response ratio of iNKT cells. PBMCs from HDs (n = 3), ACs (n = 3), and HAM/TSP (n = 3) and ATL patients (n = 3) were cultured without any treatment, with 100 ng/mL α-GalCer, or with α-GalCer (100 ng/mL) + IL-2 (100 U/mL). The fold change in the number of iNKT cells was calculated as the ratio of the absolute number of iNKT cells on day 14 divided by the absolute number of iNKT cells on day 0. Data are represented as mean ± SEM. (B) Representative FACS histogram of perforin expression by iNKT cells from HDs, ACs, and HAM/TSP patients. PBMCs were stained for perforin, Vα24Jα18, and CD3, and the expression levels of perforin in CD3+Vα24Jα18+ cells are plotted. (C) Levels of perforin expression (mean fluorescence intensity [MFI]) by CD3+Vα24Jα18+ iNKT cells of HDs, ACs, and HAM/TSP patients. PBMCs from 7 HDs, 4 ACs, and 6 HAM/TSP and 2 ATL patients were stained for perforin, Vα24Jα18, and CD3, and the expression level of perforin in each CD3+Vα24Jα18+ cell was plotted. In 2 of the 6 HAM/TSP patients and 2 ATL patients, perforin expression could not be analyzed because the frequency of iNKT cells was low. The perforin expression levels were lower in iNKT cells of ACs (P = .038), and HAM/TSP patients (P = .038) were lower than in those of HDs. The Mann-Whitney U test was used for statistical analysis. The horizontal bar represents the mean value of each group. (D) The HTLV-1 proviral load in CD3+Vα24Jα18+ (iNKT) cells and CD3+Vα24Jα18 (CD3+ cells lacking iNKT cells) cells of 4 ACs and 1 HAM/TSP patient. Paired t test was used for statistical analysis; n.s. indicates not significant. (E) The percentage of CD4 iNKT cells among total iNKT cells. PBMCs from 6 HDs and 7 HTLV-1–infected persons (1 AC, 5 HAM/TSP patients, and 1 ATL patient with detectable iNKT cells) were stained for CD3, CD4, and Vα24Jα18, the percentage of CD4+/CD4 cells among CD3+Vα24Jα18+ iNKT cells was analyzed by FACS, and the percentage of CD4 iNKT cells among total iNKT cells of each person was calculated. CD4 iNKT cells were found to be dominantly depleted in HTLV-1–infected persons compared with HDs (P = .001 by Student t test).

Similar articles

Cited by

References

    1. Uchiyama T, Yodoi J, Sagawa K, Takatsuki K, Uchino H. Adult T-cell leukemia: clinical and hematologic features of 16 cases. Blood. 1977;50(3):481–492. - PubMed
    1. Gessain A, Barin F, Vernant JC, et al. Antibodies to human T-lymphotropic virus type-I in patients with tropical spastic paraparesis. Lancet. 1985;2(8452):407–410. - PubMed
    1. Osame M, Usuku K, Izumo S, et al. HTLV-I associated myelopathy, a new clinical entity. Lancet. 1986;1(8488):1031–1032. - PubMed
    1. Nagai M, Usuku K, Matsumoto W, et al. Analysis of HTLV-I proviral load in 202 HAM/TSP patients and 243 asymptomatic HTLV-I carriers: high proviral load strongly predisposes to HAM/TSP. J Neurovirol. 1998;4(6):586–593. - PubMed
    1. Nagai M, Yamano Y, Brennan MB, Mora CA, Jacobson S. Increased HTLV-I proviral load and preferential expansion of HTLV-I Tax-specific CD8+ T cells in cerebrospinal fluid from patients with HAM/TSP. Ann Neurol. 2001;50(6):807–812. - PubMed

Publication types

MeSH terms

Substances