. 2009 Oct 22;114(17):3693-706.
doi: 10.1182/blood-2008-11-191148. Epub 2009 Aug 7.

Cytolytic T cells induce ceramide-rich platforms in target cell membranes to initiate graft-versus-host disease

Affiliations

Cytolytic T cells induce ceramide-rich platforms in target cell membranes to initiate graft-versus-host disease

Jimmy A Rotolo et al. Blood. .

Abstract

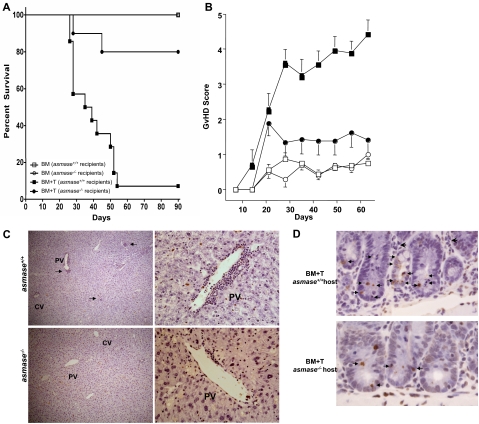
Alloreactive donor cytolytic T lymphocytes play a critical role in pathophysiology of acute graft-versus-host disease (GVHD). As GVHD progression involves tumor necrosis factor superfamily receptor activation, and as apoptotic signaling for some tumor necrosis factor superfamily receptors might involve acid sphingomyelinase (ASMase)-mediated ceramide generation, we hypothesized that ASMase deletion would ameliorate GVHD. Using clinically relevant mouse models of acute GVHD in which allogeneic bone marrow and T cells were transplanted into asmase+/+ and asmase(-/-) hosts, we identify host ASMase as critical for full-blown GVHD. Lack of host ASMase reduced the acute inflammatory phase of GVHD, attenuating cytokine storm, CD8+ T-cell proliferation/activation, and apoptosis of relevant graft-versus-host target cells (hepatocytes, intestinal, and skin cells). Organ injury was diminished in asmase(-/-) hosts, and morbidity and mortality improved at 90 days after transplantation. Resistance to cytolytic T lymphocyte-induced apoptosis was found at the target cell membrane if hepatocytes lack ASMase, as hepatocyte apoptosis required target cell ceramide generation for formation of ceramide-rich macrodomains, sites concentrating proapoptotic Fas. These studies indicate a requirement for target cell ASMase in evolution of GVHD in liver, small intestines, and skin and provide potential new targets for disease management.


Figures

Figure 1
Figure 1
Host ASMase regulates graft-versus-host–associated morbidity, mortality, and target organ injury. Lethally irradiated (1100 cGy) C57BL/6asmase+/+ or C57BL/6asmase−/− mice received intravenous injection of LP TCD-BM cells (5 × 10⁶) with or without splenic T cells (3 × 10⁶). (A) Kaplan-Meier survival and (B) clinical GVHD score derived from weekly assessment of 5 clinical parameters (weight loss, hunched posture, decreased activity, fur ruffling, and skin lesions) are shown representing 6 to 8 BM control and 13 or 14 BM + T-cell recipients per group compiled from 2 experiments. Statistical analysis is as follows: (A) BM (asmase+/+ hosts) versus BM + T (asmase+/+ hosts), P < .001; BM + T (asmase+/+ hosts) versus BM + T (asmase−/− hosts), P < .001. (B) BM (asmase+/+ hosts) versus BM + T (asmase+/+ hosts)j P < .005; BM + T (asmase+/+ hosts) versus BM + T (asmase−/− hosts)j P < .005. (C) C57BL/6asmase+/+ or C57BL/6asmase−/− mice received transplants as described in Figure 1 and were killed 21 days thereafter for histopathologic analysis. Representative 5-μm hematoxylin and eosin–stained liver sections reveal increased lymphocyte infiltration (arrows) around the central and portal veins and destruction of hepatic architecture in asmase+/+ hosts receiving allogeneic T cells compared with asmase−/− littermates (left panels). Images were acquired using Zeiss Plan-NEOFLUAR 5×/0.3 numeric aperture (NA) dry lens (Carl Zeiss Inc) and QImaging camera model Retiga EX, and were processed with Improvision Volocity software (PerkinElmer) and Adobe Photoshop Version 7.0 software (Adobe Systems). Right panels reveal higher magnification images of typical endotheliitis observed around a portal vein in asmase+/+ (top panels) but not asmase−/− (bottom panels) hosts. Images were acquired as in left panels, using a Zeiss Plan-NEOFLUAR 40×/1.3 NA oil DIC lens. (D) Representative 5-μm TUNEL-stained sections of proximal jejunum crypts displaying epithelial apoptosis. Images were acquired as in panel C, using a Zeiss Plan-NEOFLUAR 40×/1.3 NA oil DIC lens. Small arrows indicate cells containing condensed or fragmented brown nuclei contrasting with the blue stain of nonapoptotic nuclei, quantified in panel E. Large arrows indicate areas of inflammatory cell infiltration. Crypt apoptosis (E) was scored in 200 crypts per point. Data (mean ± SEM) are collated from 2 experiments. Frequency histograms of apoptotic cells in the villus lamina propria (F) represent data from 150 villae per point, collated from 2 experiments. (G) C57BL/6 recipient hosts received marrow transplants as detailed earlier in the Figure 1 legend, and skin (tongue and ear) was harvested 21 days thereafter. Alternatively, skin was harvested 14 days after transplantation of 10 × 106 TCD-BM cells with or without 0.5 × 10⁶ T cells from B10.BR (H2k) donors. Skin GVHD score was determined by the number of dyskeratotic apoptotic keratinocytes per millimeter of epidermis (mean ± SEM) as assessed in blinded fashion on hematoxylin and eosin–stained sections. Data represent 4 to 14 mice per group compiled from 3 independent experiments.
Figure 1
Figure 1
Host ASMase regulates graft-versus-host–associated morbidity, mortality, and target organ injury. Lethally irradiated (1100 cGy) C57BL/6asmase+/+ or C57BL/6asmase−/− mice received intravenous injection of LP TCD-BM cells (5 × 10⁶) with or without splenic T cells (3 × 10⁶). (A) Kaplan-Meier survival and (B) clinical GVHD score derived from weekly assessment of 5 clinical parameters (weight loss, hunched posture, decreased activity, fur ruffling, and skin lesions) are shown representing 6 to 8 BM control and 13 or 14 BM + T-cell recipients per group compiled from 2 experiments. Statistical analysis is as follows: (A) BM (asmase+/+ hosts) versus BM + T (asmase+/+ hosts), P < .001; BM + T (asmase+/+ hosts) versus BM + T (asmase−/− hosts), P < .001. (B) BM (asmase+/+ hosts) versus BM + T (asmase+/+ hosts)j P < .005; BM + T (asmase+/+ hosts) versus BM + T (asmase−/− hosts)j P < .005. (C) C57BL/6asmase+/+ or C57BL/6asmase−/− mice received transplants as described in Figure 1 and were killed 21 days thereafter for histopathologic analysis. Representative 5-μm hematoxylin and eosin–stained liver sections reveal increased lymphocyte infiltration (arrows) around the central and portal veins and destruction of hepatic architecture in asmase+/+ hosts receiving allogeneic T cells compared with asmase−/− littermates (left panels). Images were acquired using Zeiss Plan-NEOFLUAR 5×/0.3 numeric aperture (NA) dry lens (Carl Zeiss Inc) and QImaging camera model Retiga EX, and were processed with Improvision Volocity software (PerkinElmer) and Adobe Photoshop Version 7.0 software (Adobe Systems). Right panels reveal higher magnification images of typical endotheliitis observed around a portal vein in asmase+/+ (top panels) but not asmase−/− (bottom panels) hosts. Images were acquired as in left panels, using a Zeiss Plan-NEOFLUAR 40×/1.3 NA oil DIC lens. (D) Representative 5-μm TUNEL-stained sections of proximal jejunum crypts displaying epithelial apoptosis. Images were acquired as in panel C, using a Zeiss Plan-NEOFLUAR 40×/1.3 NA oil DIC lens. Small arrows indicate cells containing condensed or fragmented brown nuclei contrasting with the blue stain of nonapoptotic nuclei, quantified in panel E. Large arrows indicate areas of inflammatory cell infiltration. Crypt apoptosis (E) was scored in 200 crypts per point. Data (mean ± SEM) are collated from 2 experiments. Frequency histograms of apoptotic cells in the villus lamina propria (F) represent data from 150 villae per point, collated from 2 experiments. (G) C57BL/6 recipient hosts received marrow transplants as detailed earlier in the Figure 1 legend, and skin (tongue and ear) was harvested 21 days thereafter. Alternatively, skin was harvested 14 days after transplantation of 10 × 106 TCD-BM cells with or without 0.5 × 10⁶ T cells from B10.BR (H2k) donors. Skin GVHD score was determined by the number of dyskeratotic apoptotic keratinocytes per millimeter of epidermis (mean ± SEM) as assessed in blinded fashion on hematoxylin and eosin–stained sections. Data represent 4 to 14 mice per group compiled from 3 independent experiments.
Figure 2
Figure 2
Preconditioning injury or host immune function does not contribute to impaired GVHD sensitivity in asmase−/− recipients. (A) Wild-type and asmase−/− C57BL/6 mice were exposed to 11-Gy split-dose radiation (5.5 Gy × 2 separated by 3 hours) or 11-Gy single dose. Proximal jejunum was harvested 3.5 days thereafter, and the microcolony assay performed according to the method of Withers and Elkind. Data (mean ± SEM) were compiled from 2 to 4 animals irradiated concomitantly, with 10 to 20 circumferences scored per mouse. (B) Irradiated (350 cGy split-dose) SCID-C57BL/6asmase+/+ or SCID-C57BL/6asmase−/− mice received BM and T cells as in Figure 1A, and were monitored for survival. Note that SCID-C57BL/6asmase−/− mice died with significant lung and central nervous system damage consistent with development of accelerated NPD while displaying only minimal to moderate evidence of GVHD (supplemental Table 2). (C) Actuarial survival of 8- to 12-week-old male wild-type and asmase−/− C57BL/6 mice exposed to 10 or 12 Gy whole-body radiation. Actuarial survival was calculated by the product-limit Kaplan-Meier method. Nine to 12 animals were irradiated per group.
Figure 3
Figure 3
Donor CD8+ T-cell expansion is impaired in asmase−/− hosts. C57BL/6asmase+/+ and C57BL/6asmase−/− recipients were infused with 15 to 206 CFSE-stained splenic CD3+ T cells from LP/J donors as described in “Flow cytometric analysis and in vivo CFSE staining.” Spleens were harvested 7 days thereafter and multicolor flow cytometry was performed. Percentage of CFSE “high” (cells with mean fluorescent values ≥ 104) and “low” (mean fluorescent values ≤ 103) CD4+ and CD8+ populations are shown from 1 representative of 2 independent experiments.
Figure 4
Figure 4
In vivo activated allogeneic CTLs require target hepatocyte ASMase for efficient killing ex vivo. Hepatocytes, isolated as described in “Hepatocyte isolation,” were coincubated with splenic T cells harvested from lethally irradiated wild-type C57BL/6 recipients 10 to 14 days after transplantation of LP BM+ T cells. (A) A total of 2 × 10⁶ GVH-activated splenic CTLs were coincubated with 0.5 × 10⁶ wild-type C57BL/6 or B6.MRL.lpr (FasR−/−) hepatocytes (left panel) in complete medium for 16 hours. Alternatively, dimethyl sulfoxide– or concanamycin A–pretreated (100 ng/mL, 30 minutes) GVH-activated splenic CTLs were coincubated with 0.5 × 10⁶ wild-type C57BL/6 hepatocytes for 16 hours (right panel). Apoptosis was quantified after fixation by nuclear bisbenzimide staining. (B) asmase−/− hepatocytes are resistant to apoptosis induced by GVH-activated splenic CTLs. CTL coincubation was performed as in panel A, and apoptosis was quantified 16 hours thereafter. (C) Representative images of asmase+/+ (top left panel) and asmase−/− (bottom left panel) C57BL/6 hepatocytes after 10 minutes of coincubation in suspension with 2 × 10⁶ GVH-activated splenic T cells. Hepatocytes were fixed and stained with 4,6-diamidino-2-phenylindole (DAPI) and Cy-3-labeled anticeramide mAb as described in “Hepatocyte apoptosis and platform detection assays.” Arrows indicate ceramide-rich platform generation on the outer leaflet of the plasma membrane. Note that, after incubation, cells were centrifuged at 50g for 4 minutes at 4°C before staining and imaging. Hence, CTLs (small blue nuclei) distributed with hepatocytes (large blue nuclei) do not reflect biologic association. Images were acquired using Zeiss Plan-NEOFLUAR 40×/1.3 NA oil DIC lens and Zeiss AxioCam MRm camera, and were processed with Zeiss AxioVision software and Adobe Photoshop Version 7.0 software. (D) Quantification of ceramide-rich platforms in asmase+/+ and asmase−/− hepatocytes after incubation with 2 × 10⁶ GVH-activated splenic CTLs. A total of 0.5 × 10⁶ hepatocytes were coincubated for the indicated times, fixed, and stained as in panel C. Exogenous C16-ceramide bypasses the requirement for target cell ASMase, restoring platform generation (E) and conferring apoptosis (F) onto GVH-activated CTL-stimulated asmase−/− hepatocytes. Platform generation and apoptosis were quantified as in panels D and A, respectively. (G) Disruption of membrane GEMs with nystatin inhibits CTL-induced hepatocyte apoptosis. A total of 0.5 × 10⁶ wild-type hepatocytes, preincubated with 50 μg/mL nystatin for 30 minutes and resuspended in RPMI containing 1% lipid-free FBS, were coincubated with 2 × 10⁶ GVH-activated splenic T cells, and apoptosis was quantified as in panel A. Data (mean ± SEM) represent triplicate determinations from 3 independent experiments each for panels A, B, D, E, F, and G.
Figure 5
Figure 5
In vitro–activated CTLs require target splenocyte ASMase for efficient killing. (A) Representative images and (B) quantification of ceramide-rich platforms (indicated by arrows in panel A) formed on the surface of Mitotracker Red–labeled, conA-activated (5 μg/mL for 24 hours) target C57BL/6asmase+/+ and C57BL/6asmase−/− splenocytes, on coincubation for 20 minutes with effector Balb/c splenic T cells that had been activated in vitro with 2 × 10⁶ irradiated (20 Gy) C57BL/6 splenocytes/mL media for 5 days at a target/effector ratio of 2:1. Target splenocytes were fixed with 4% formalin-buffered phosphate, and stained with DAPI and FITC-labeled anticeramide mAb. Images were acquired as in Figure 4C. Platforms were identified as previously described. (C) Lysis of 51Cr-labeled target C57BL/6asmase+/+ and C57BL/6asmase−/− splenocytes after coincubation with effector Balb/c splenic T cells for 6 hours measured by the chromium-release assay. (D) Cytolytic response of 51Cr-labeled target C57BL/6asmase−/− splenocytes to activated effector Balb/c splenic T cells as in panel B, in the presence of 500 nM C16-ceramide or C16-dihydroceramide (DCer). Data (mean ± SEM) represent triplicate samples from 3 independent experiments for panels B through D.
Figure 6
Figure 6
Activation-induced cell death of splenocytes requires ASMase for efficient killing. (A) Representative images and (B) quantification of ceramide-rich platforms (arrows) formed on the surface of C57BL/6asmase+/+ and C57BL/6asmase−/− C57BL/6 splenic T cells 4 hours after induction of AICD with 10 ng/mL anti-CD3 as described in “Activation-induced cell death.” Cells were fixed with 4% formalin-buffered phosphate and stained with DAPI and FITC-labeled anticeramide mAb as in Figure 4C. Images were acquired as in Figure 4C. AICD induces a 2.0- ± 0.1-fold increase in the overall ceramide signal as determined by mean fluorescence intensity in asmase+/+ T cells (P < .005 compared with unstimulated controls), not evident in asmase−/− T cells, accounting for the difference in overall staining between panels. (C) Apoptotic response of C57BL/6asmase+/+ or C57BL/6asmase−/− splenic T cells after AICD apoptotic fratricide was induced as in panel A. Apoptosis was quantified 16 hours thereafter after nuclear bisbenzimide staining. (D) AICD was initiated in C57BL/6asmase−/− splenic T cells as in panel A, in the presence of 500 nM C16-ceramide or C16-dihydroceramide. Apoptosis was quantified 16 hours thereafter after nuclear bisbenzimide staining. Data (mean ± SEM) represent triplicate samples from 3 independent experiments for panels B through D.

Comment in

Similar articles

Cited by

References

    1. Ferrara JL, Reddy P. Pathophysiology of graft-versus-host disease. Semin Hematol. 2006;43(1):3–10. - PubMed
    1. van den Brink MRBSJ. Cytolytic pathways in haematopoietic stem-cell transplantation. Nat Rev Immunol. 2002;2:273–281. - PubMed
    1. Baker MB, Altman NH, Podack ER, Levy RB. The role of cell-mediated cytotoxicity in acute GVHD after MHC-matched allogeneic bone marrow transplantation in mice. J Exp Med. 1996;183(6):2645–2656. - PMC - PubMed
    1. Braun MY, Lowin B, French L, Acha-Orbea H, Tschopp J. Cytotoxic T cells deficient in both functional fas ligand and perforin show residual cytolytic activity yet lose their capacity to induce lethal acute graft-versus-host disease. J Exp Med. 1996;183(2):657–661. - PMC - PubMed
    1. Graubert TA, DiPersio JF, Russell JH, Ley TJ. Perforin/granzyme-dependent and independent mechanisms are both important for the development of graft-versus-host disease after murine bone marrow transplantation. J Clin Invest. 1997;100(4):904–911. - PMC - PubMed

Publication types

MeSH terms